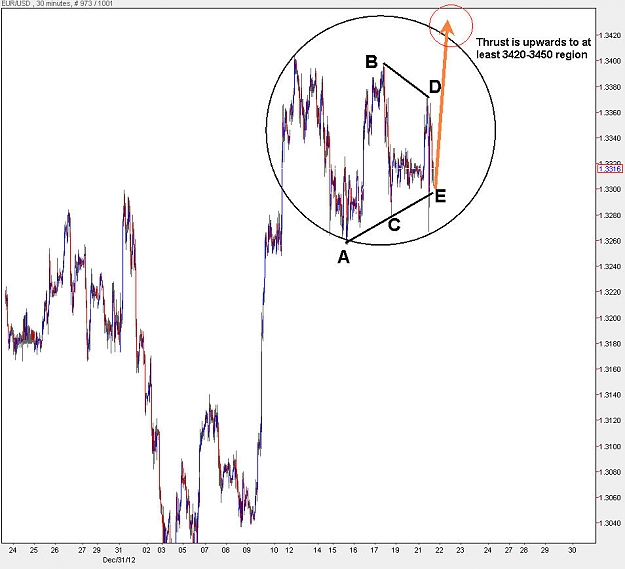
The EUR needs a spike up before a reversal takes place. This spike up has not materialized yet, and its going to most probably be around the 1.146 price extension of the move from 3040-3404 which is 3449. This is considering the triangle situation that we have on the daily time frame mentioned in the following post:
Currently we have another triangle developing on M30 which implies more upward thrust to happen soon. In the event that we go above 3450, then the triangle situation on the daily time frame is nullified and we will most probably end up at the highs of 3500 after that.
For today its still a buy with little hopes of going below 3250 for now
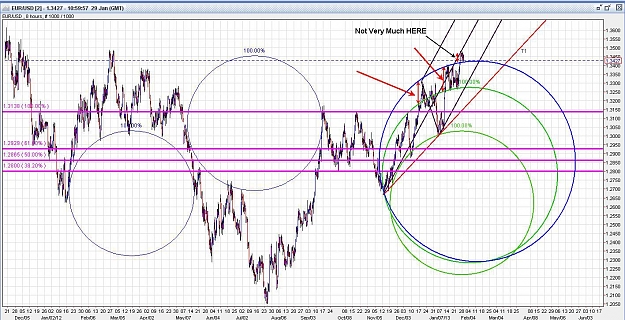
Given the period of 2 days, the EUR has barely tried to make it anything above 3350, and be able to sustain it.
It has been trying quite hard to make any distinct progress beyond the 3350-3370 region.
"Distinct progress" means surges of at least 150-200 pips.
Given this behaviour and the inability of this pair to reach the heavy black median line (T1), the only other conclusion to make is that the triangular structure shown by the converging blue lines is forming a triangle with a huge thrust downwards. This thrust must clear the base of Wave A.
We are also at the pole of 2 circles, with motion showing more difficulty to penetrate through these regions. This behaviour is only re-enforcing the power that these 2 circles are exerting on the upward motion, which will cause a pole bounce downwards.
For now because of no attempt towards the median line and the above mentioned circle, the break of the AC trendline in the above triangle is a false break of any hopes going upwards.
A strong sell is about to begin anytime within the next 24 hours. The Full Moon is also tomorrow
Given the period of 2 days, the EUR has barely tried to make it anything above 3350, and be able to sustain it.
It has been trying quite hard to make any distinct progress beyond the 3350-3370 region.
"Distinct progress" means surges of at least 150-200 pips.
Given this behaviour and the inability of this pair to reach the heavy black median line (T1), the only other conclusion to make is that the triangular structure shown by the converging blue lines is forming a triangle with...
For now because of no attempt towards the median line and the above mentioned circle, the break of the AC trendline in the above triangle is a false break of any hopes going upwards.
A strong sell is about to begin anytime within the next 24 hours. The Full Moon is also tomorrow
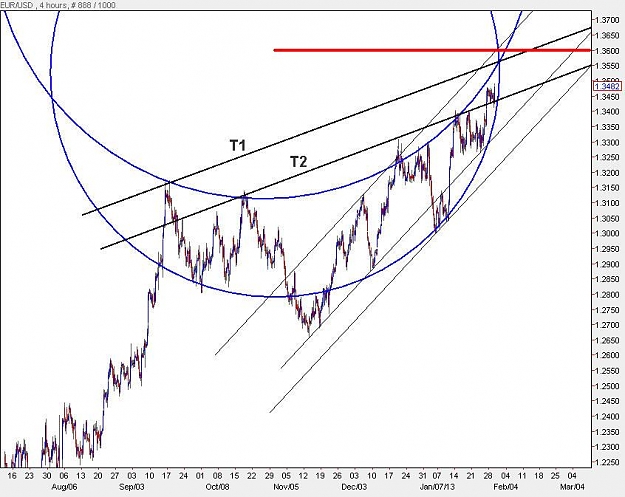
Behaviourwise Median lines offer one of the strongest rebounds if a trend is about to finish. We will have to see about that next week. Agreed with Egkid that we would be going at least to the highs of 3500
agree with your fib fans, after so much consolidation.
The problem with the recent thrusts upward is that they loose momentum too quickly and that maybe what is confusing me the most recently.
The Elliot Wave patterns when a strong thrust emerges imply either a ending C wave or a beginning Wave 3, but for the most part after the large delays after the thrusts happens the behaviour of the chart does not fit either of the scenarios.
For right now as long as we dont get a solid candle down on the daily chart we will continue to go up. The prolem is that when such candles occur they give very little warning beforehand about their intentions, which makes it more scary to keep on buying at the resistances, which right now looks like the better tactic.
agree with your fib fans, after so much consolidation.
The problem with the recent thrusts upward is that they loose momentum too quickly and that maybe what is confusing me the most recently.
The Elliot Wave patterns when a strong thrust emerges imply either a ending C wave or a beginning Wave 3, but for the most part after the large delays after the thrusts happens the behaviour of the chart does not fit either of the scenarios.
For right now as long as we dont get a solid candle down on the daily chart we will continue to go up....
Ignored
Thank you Kambooj for your analysis, I need a lot to learn about E wave, I know it by skin deep only, is there any good and straight forward (and short) :-) article about EW ,a link may be....:-)
Anyway, you can see below the different view of the lines, (fibo , different leg) it makes a small cluster of fibo. the price was really rejected from 38.2 /1.3464) , I think it's about time to sell Kambooj http://primuspersada.com/images/dweu.png
I was just gonna post my charts now, after seeing your drawing I agree with the outcome.
Mine are just the same outcome looked at from a different view:
Here is the outlook for today:
EUR/USD Outlook
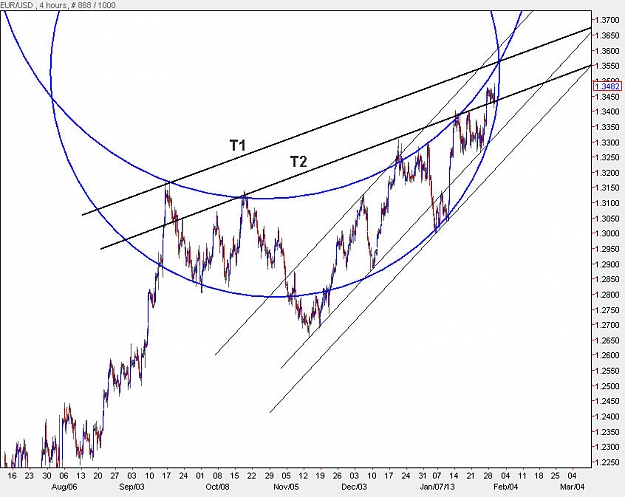
We have a cresent moon structure on the H4 chart which usually indicates some sort of exhaustion in the upward movement, as to whether we want to go long right now its advicable to stay aside, beause these structures usually imply the last move of a desperate trend. If there is a turn around the movement can turn back anywhere within T1-T2 lines, which also correspond to the outmost curvature of the cresent. A possible reversal will take us to 3270
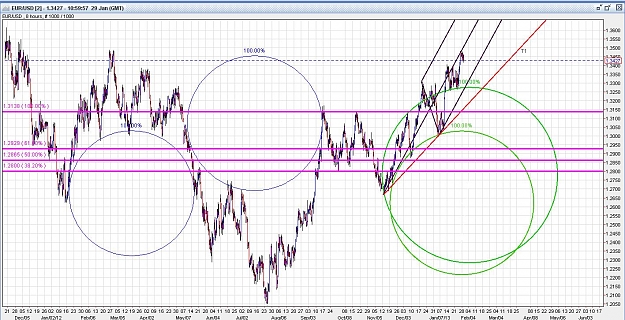
I have drawn one other circle on top of yours, which basically makes the green + blue circles like a shell like diagram. Since you are at the median line of the pitch fork, which is well drawn and barely above the pole of the blue circle, you can conclude that the probability of further thrust to break the median line is decreasing.
That and plus the fact that the thrust out of the pole of the blue circle is not showing the same sustenance as the ones that I have shown with the red arrow.
Thanks for the diagram and good luck in your analysis
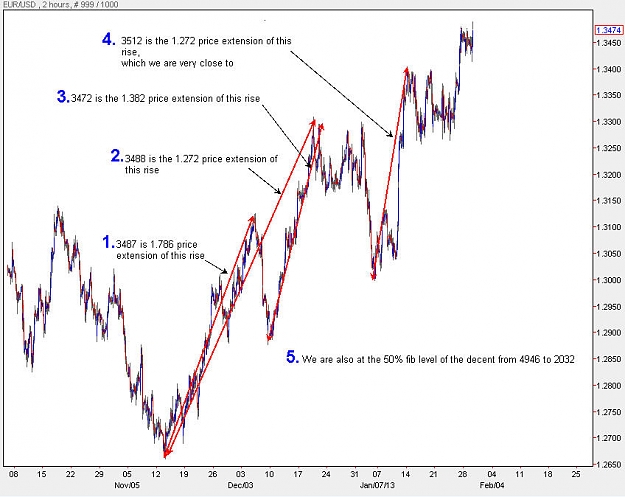
Usually I have found that turn around spots are within 120-150 pip of what we think it will happen, So the limit that you have set looks quite reasonable to me. The following overlapping fib levels are what we are at right now:
I have drawn one other circle on top of yours, which basically makes the green + blue circles like a shell like diagram. Since you are at the median line of the pitch fork, which is well drawn and barely above the pole of the blue circle, you can conclude that the probability of further thrust to break the median line is decreasing.
That and plus the fact that the thrust out of the pole of the blue circle is not showing the same sustenance as the ones that I have shown with the red arrow.
Thanks for the diagram and good luck in your analysis...
Ignored
Down to 3250 (the bigger green circle and then back upto the blue ?
On the daily its also on the lower pitchfork line.
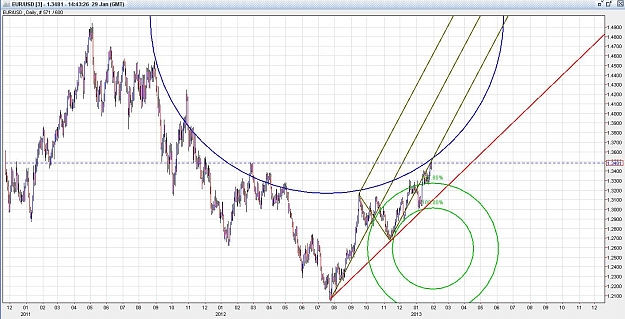
I elliot wave terminology you can have a 5th wave extension impulse wave if what we are experiencing from 2030 on the daily chart is a impulse wave. in that case we can easily go to the 4000 level.
But the structure is so convoluted now, that I am cautious to say after that what will happen. It all depends on the amount of momentum that gets generated when the drop happens.
If we have a situation like May of 2012, we will probably go below 2030 level
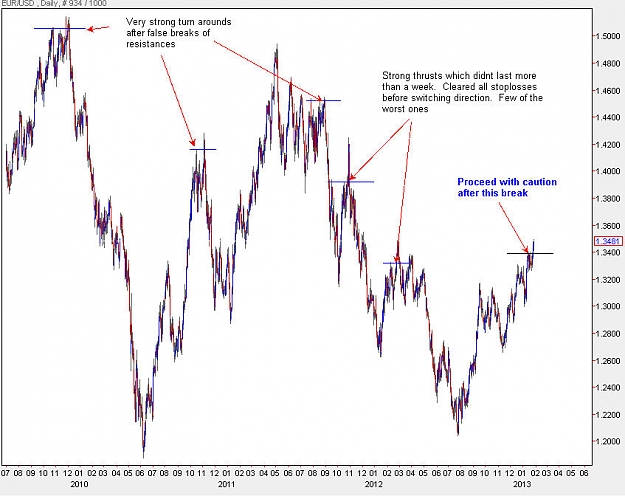
The failed Off shoots of a resistance is a phenomenon that you get very close to a turn around. I have shown some examples on the daily chart. The 2 worst ones that happened was at 3914 on Oct 27 2011, which lasted only very few days and the other one was at February 21 2012 which only lasted a week.
So have to be carefull in situations where excitable momentum gets generated when a resistance breaks, which is close to several overlapping fib levels
I elliot wave terminology you can have a 5th wave extension impulse wave if what we are experiencing from 2030 on the daily chart is a impulse wave. in that case we can easily go to the 4000 level.
But the structure is so convoluted now, that I am cautious to say after that what will happen. It all depends on the amount of momentum...