Dislikedwell.... well...
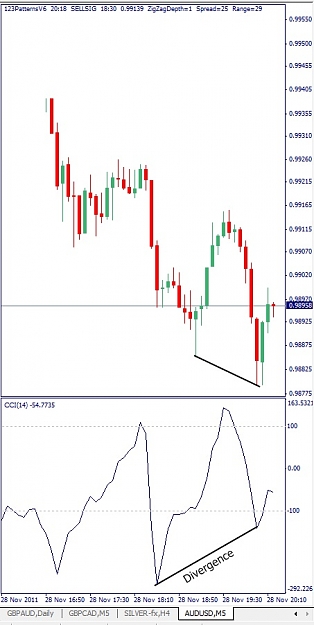
AUDUSD... M15 chart... possible Divergence!
http://i.imgur.com/BbVT1.gif
hit another 25 pip stop loss. any explanation ?
Hopefully from FXcube...
thanks
kaderIgnored
AUDUSD, M5, 2011 November 28
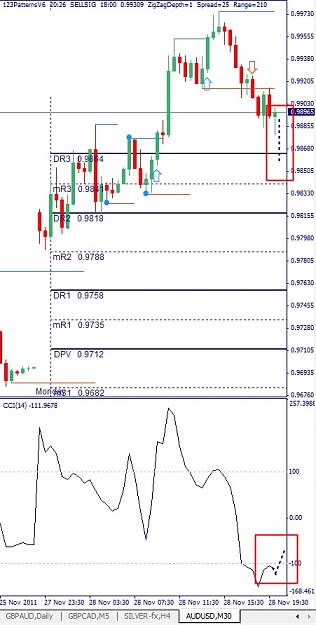
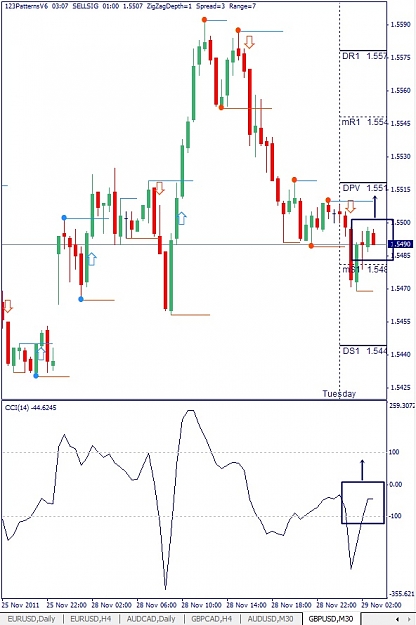
AUDUSD, M30, 2011 November 28
Hi only1kader!
Your first step could be a good choice.
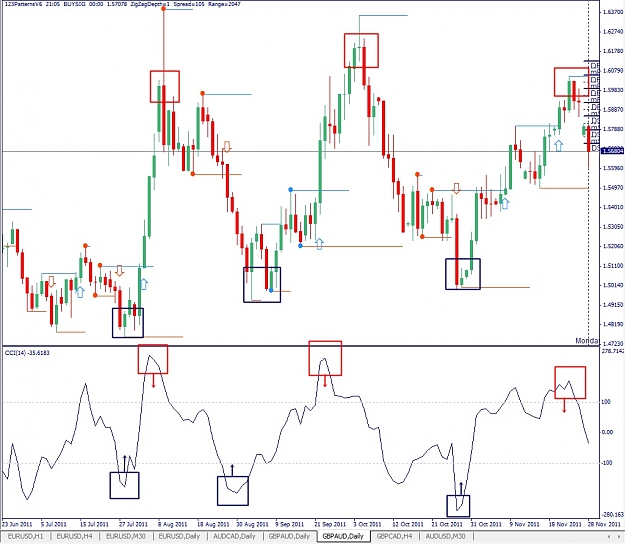
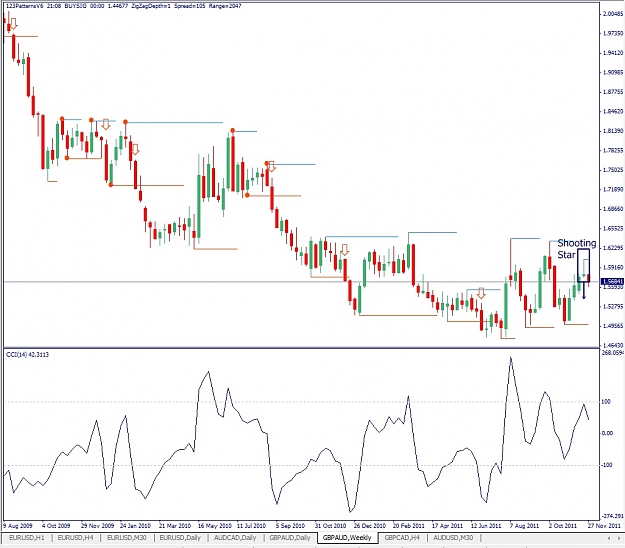
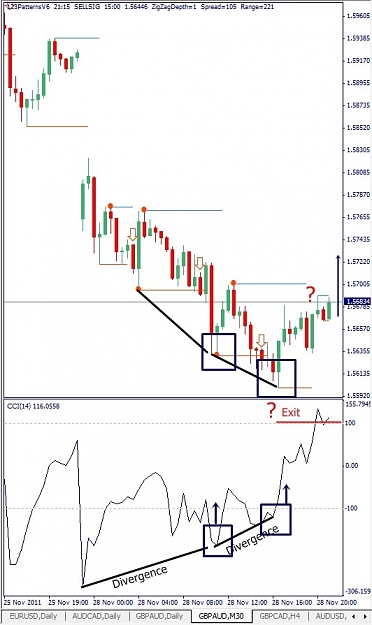
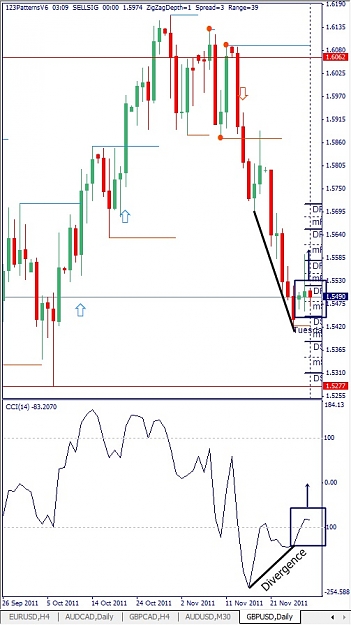
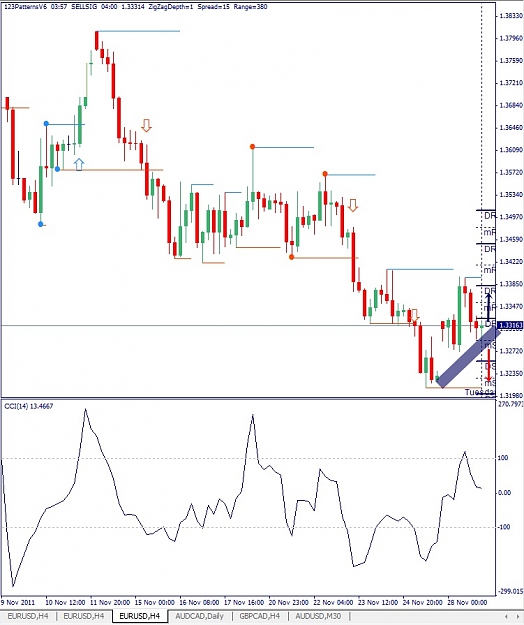
I would compare now M5, M30, H1, H4 and Daily and would select from this multiple time frame analysis these charts which could give the highest probabilities for making a profit. (Daily looks great, also up; H4 not so, H1 indifferent, M30 seems to be also signalize an up like M15). I would also trade the M5 pos. divergence with a Long and keep in mind that the next pivotal is DR3 0.9864. The actual market price (0.9896) could move more downwards by increasing Volatility and DR3 could be hit. Then we could also get something like the M30 chart below.
FXcube
Attached Image(s) (click to enlarge)