- Search Forex Factory
- 97 Results
- daffy replied Jun 23, 2010
test chart posting — test chart posting for mal EDIT: Seems it works ok for me
vsa with Malcolm
- daffy replied Feb 28, 2010
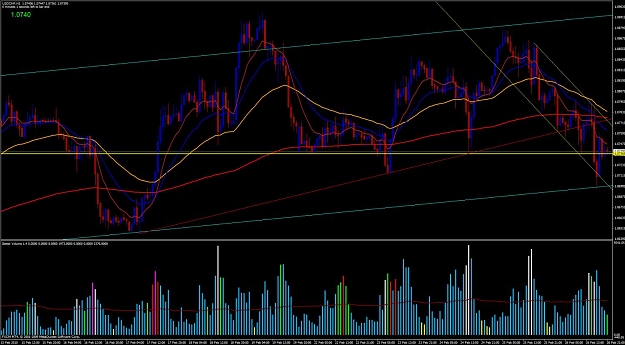
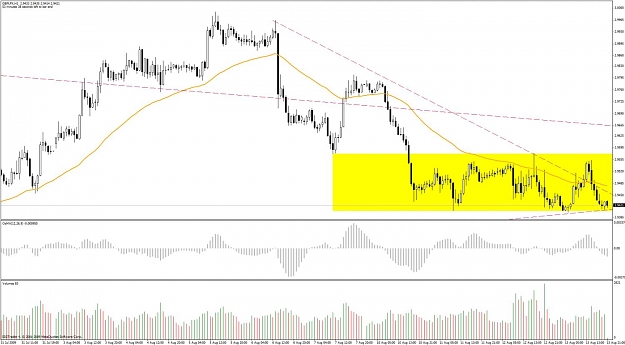
Just a heads up, I got an h4 channel (aqua) on my chart that you're missing on yours, I think it might be in play now. There's also the narrow hourly downward channel, (orange) and the old upward sloping trendline (red). I think a good short area ...
The WoRmHoLe
- daffy replied Aug 29, 2009
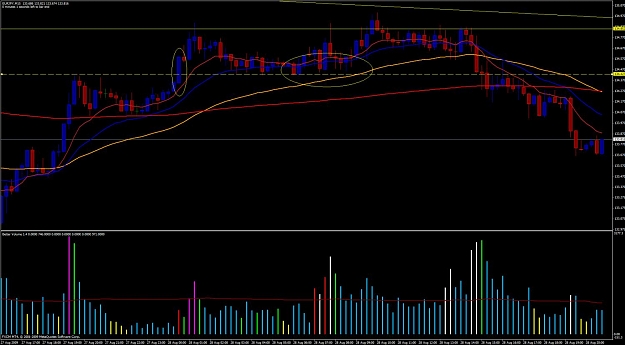
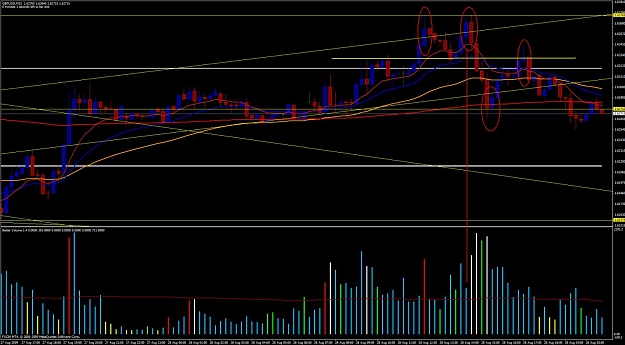
Here's a trade I took on EJ. First the background. Notice the dotted yellow line, this area marks to the far left, an area where we had previous supply. The first circled candle indicates where we pushed through this previous supply. Given this ...
Trade Using VSA (Volume Spread Analysis)
- daffy replied Aug 29, 2009
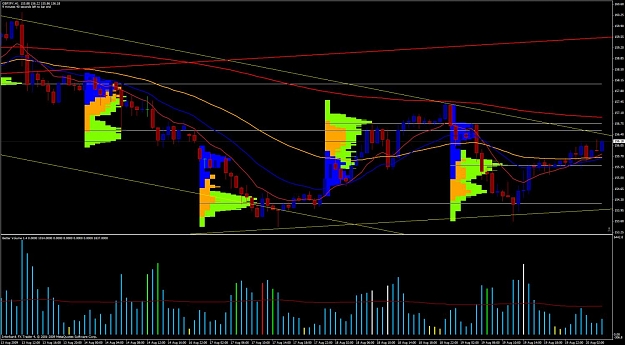
Here's some stuff I saw on Friday. Apologies for the crudeness of my charts, I'm using microsoft paint to annotate. First off, the white horizontal lines on my chart are previous point of controls (poc) from marketprofile. The horizontal yellow ...
Trade Using VSA (Volume Spread Analysis)
- daffy replied Aug 28, 2009
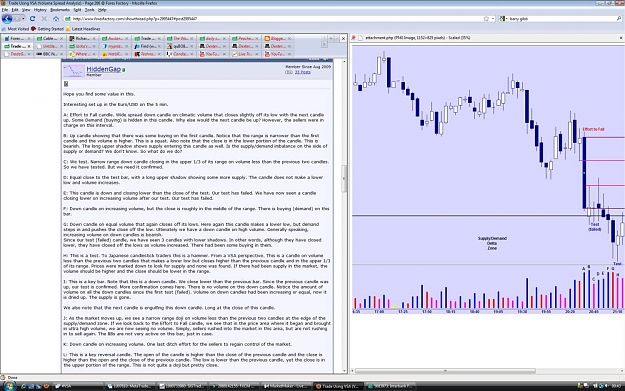
Definitely not VSA, but here's a link to a handy firefox addon that lets me view charts and the associated analysis a little easier. url Before I found this, I was constantly flicking through two windows or tabs so that I read a bit of analysis, ...
Trade Using VSA (Volume Spread Analysis)
- daffy replied Aug 26, 2009
Perhaps wormy is training for the extreme ironing championship, he needs to practice his iron pushing technique to get even the most stubborn creases out of his shirt.
Cable Update (GBPUSD)

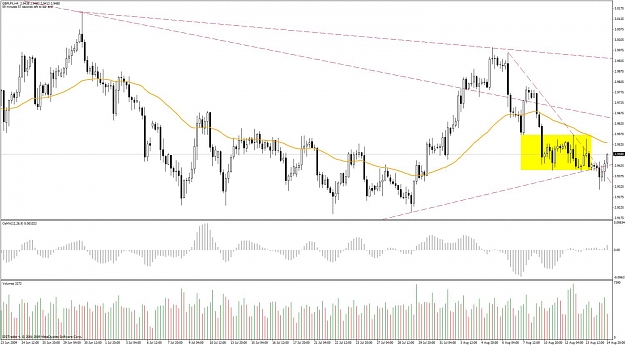
- daffy replied Aug 20, 2009
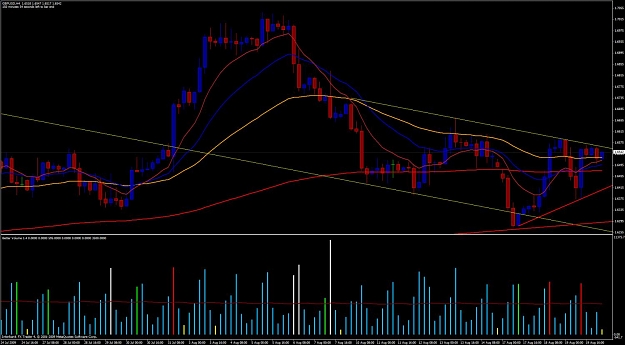
Here's what I see I'm short while the upper utl of the channel and 6600 holds.
Cable Update (GBPUSD)
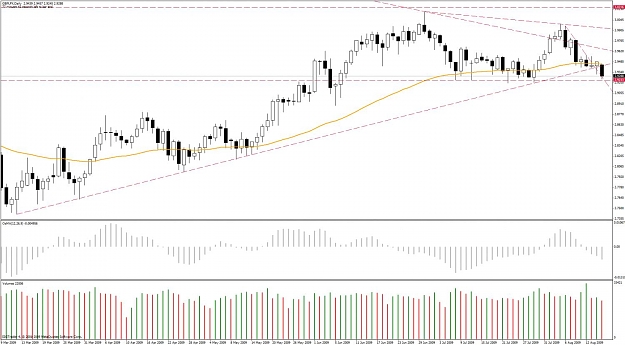
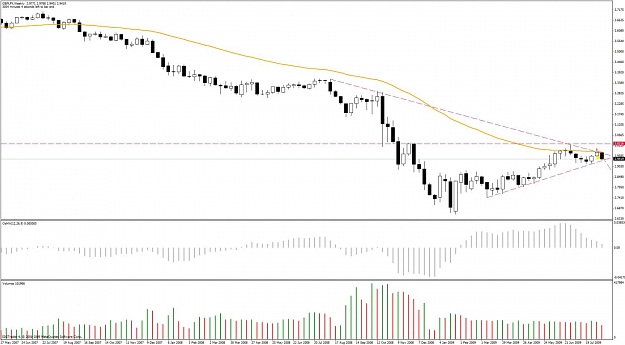
- daffy replied Aug 17, 2009
We found buyers on Friday, but today the bears covered Friday's wick. I think further movement south is possible, but we need to break 2.92 support. If that goes, next target would be 2.88.
Daily candle chart
- daffy replied Aug 17, 2009
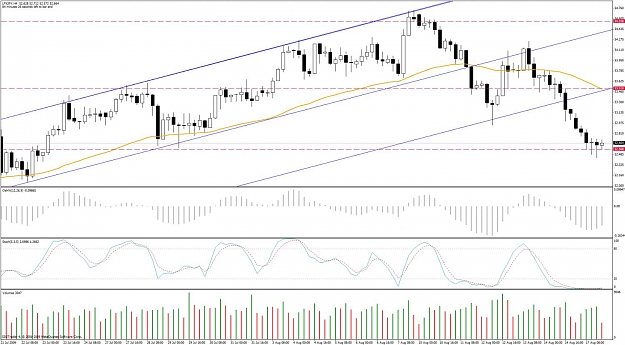
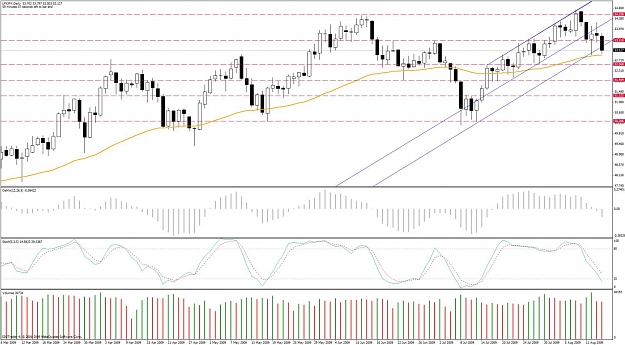
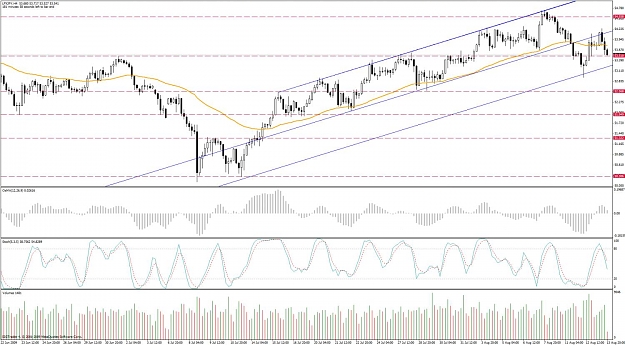
LFXJPY ran pretty much as expected today, don't see a reason why we wouldn't get more of the same tomorrow. We've found some interest at a prior resistance, as indicated on the h4 chart, perhaps we'll see a retrace to the 53 area, which would ...
Daily candle chart
- daffy replied Aug 17, 2009
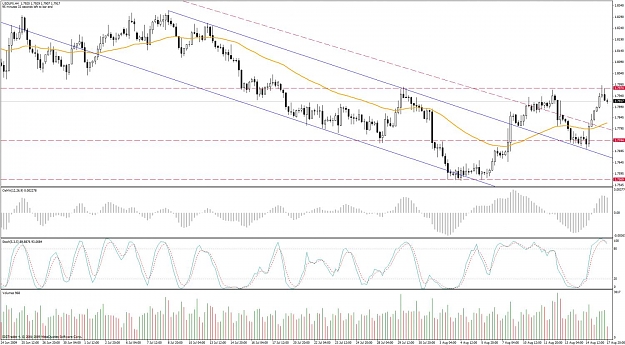
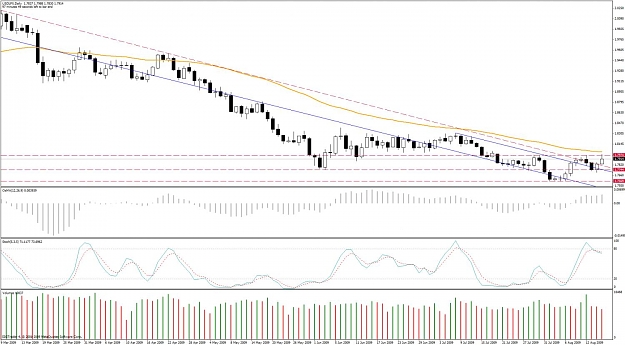
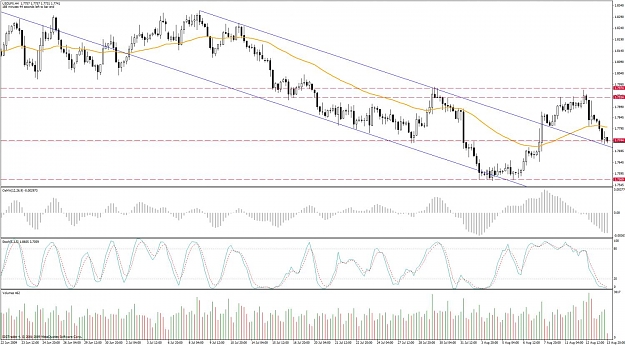
Well, seems like 1.80 is the line in the sand for usdlfx. We've tried to break it several times now, but the door seems to slam shut each time. On the h4, we have a possible shooting star formation off the 1.80 resistance. On the plus side for the ...
Daily candle chart
- daffy replied Aug 16, 2009
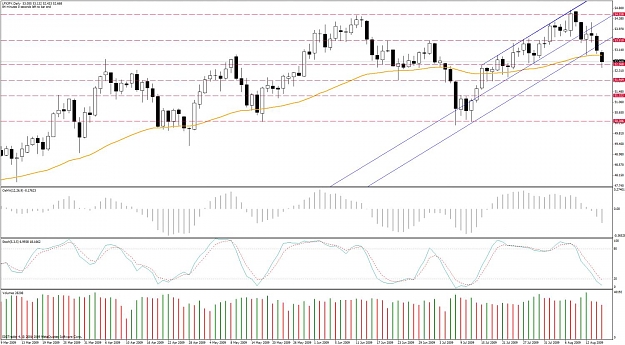
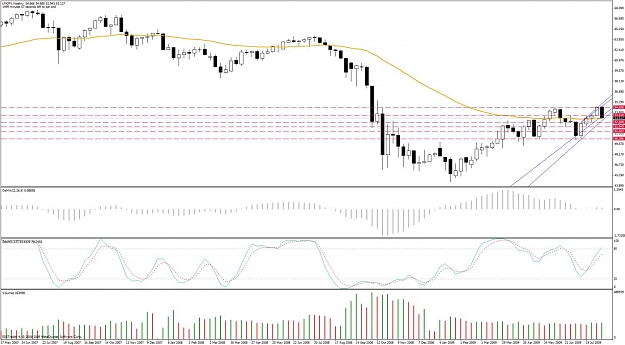
LFXJPY looks bearish. The daily seems to be playing out the 3 inside down from earlier in the week, and on the weekly, we have a bearish engulfing, double top, at resistance. Immediate resistance is at the low of Wednesday's candle, and the orange ...
Daily candle chart
- daffy replied Aug 16, 2009
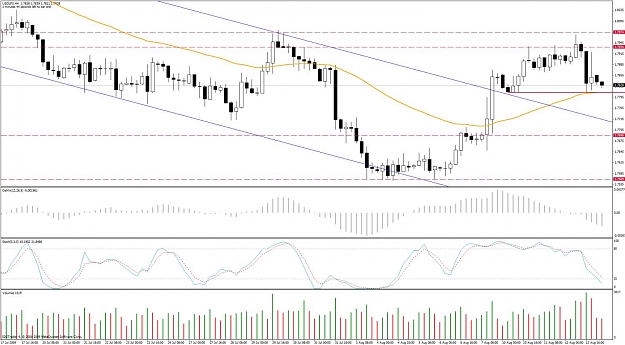
Usdlfx seems to be being supported by utl of the old channel. On the h4, we tested, the utl twice, and then had a big rejection of lower prices, engulfing the previous bar. On the daily, we had a three outside down off resistance, followed by a ...
Daily candle chart
- daffy replied Aug 16, 2009
Well, we did break the trendline on gbplfx, but then we recovered to close above it. On the H4, it looks like we had a harami, followed by 2 up bars. On the daily we potentially have a bullish hammer, but on the weekly, we have an engulfing, and ...
Daily candle chart

- daffy replied Aug 14, 2009
Talking of H&S formations, this one on the dow daily failed spectactularly. A site I visit remarked that this was the smart money pushing the news out there; this formation was being talked about on cnbc, bloomberg, the papers, everywhere! They ...
Cable Update (GBPUSD)
- daffy replied Aug 13, 2009
GBPLFX is at a key point I think. It looks like the lower trendline is going to come under real pressure. Check out the weekly thus far, that's a particularly bearish candle based on the movement of the first four days of the week. The orange line ...
Daily candle chart
- daffy replied Aug 13, 2009
Good call on that bounce, Bones. Here's a followup, I think the chart speaks for itself. I think we'll break the support, and then look to head towards the ltl of the channel.
Daily candle chart
- daffy replied Aug 13, 2009
I have observed them moving in 'opposite' directions on lower timeframes, I hadn't ever put up daily charts and looked at them side by side. Nice post.
Daily candle chart First level hit on $LFX, we're currently resting at 1.7750. Unclear whether this level ...
- daffy replied Aug 13, 2009
I think a retest of the h4 lows is on the cards today, circa the 1.7800 level, break through that, we're looking at 1.7750. If that goes, you'd have to think a retest of the recent low at 1.7550.
Daily candle chart
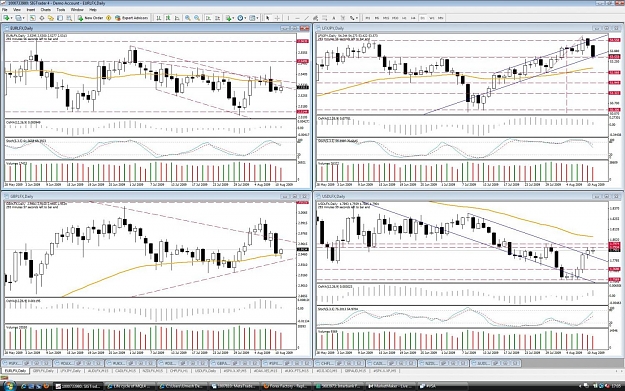
- daffy replied Aug 11, 2009
Possibility of a bearish advance block into prior resistance on usdlfx daily. Possibility of a morning star formation off a long term trendline. LFXJPY, bearish 3 inside down perhaps? Anyone have any thoughts about validity?
Daily candle chart