what charts are you using?
I seem to like it better than those with metatrader..
They are much clearer and easier to understand..
where can I find them? is it also free?
what charts are you using?
I seem to like it better than those with metatrader..
They are much clearer and easier to understand..
where can I find them? is it also free?
Thanks,
Troy
Ignored
Try IFC markets or Vt trader... Down load a free demo... there are many.. all better than metatrader4.. or accucharts..
Change chart properties..example get rid of Grid lines...Make the colour white for grid...
|
Joined Jan 2009
|
Status: Show me the pips!
|651 Posts
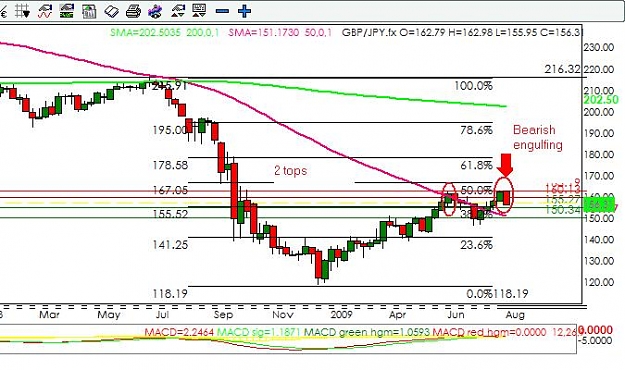
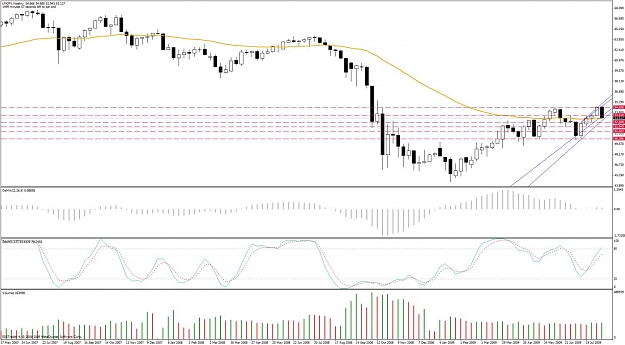
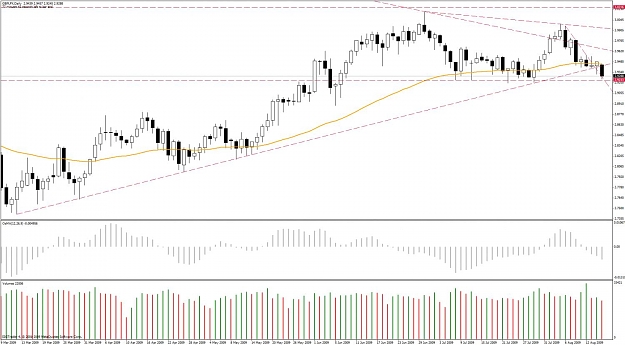
Well, we did break the trendline on gbplfx, but then we recovered to close above it. On the H4, it looks like we had a harami, followed by 2 up bars. On the daily we potentially have a bullish hammer, but on the weekly, we have an engulfing, and potential double top at resistance.
Peaches has commented on this before, that when we see a bearish engulfing, it's like the universal sign for down movement, but the bears are willing to let the bulls recover some ground, since it allows them to get better positions, and allows some of the bulls to get out of the market which will ease the path on the way down.
We also have japan gdp figures coming out early Monday, which, if they are bad, might just trigger risk aversion trading and send the pound plummeting, otherwise, I think we may have the potential for a modest pound recovery before the bears make their play. Key levels to watch to the upside would seem to be the top of the yellow rectangle, followed by the two sloping trendlines.
|
Joined Jan 2009
|
Status: Show me the pips!
|651 Posts
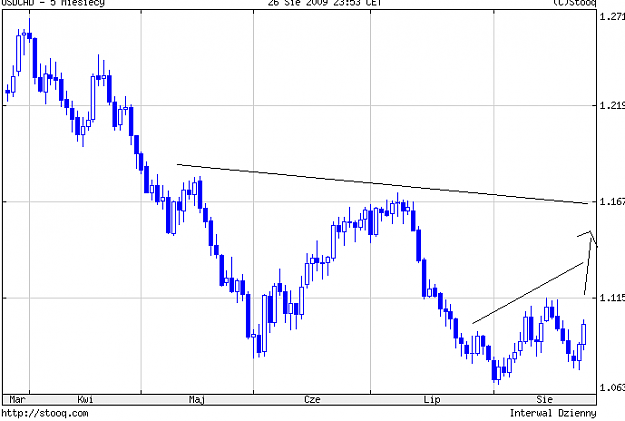
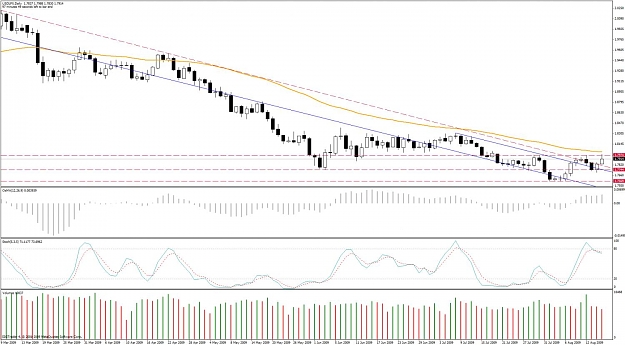
Usdlfx seems to be being supported by utl of the old channel.
On the h4, we tested, the utl twice, and then had a big rejection of lower prices, engulfing the previous bar.
On the daily, we had a three outside down off resistance, followed by a recovery by the bulls off support. We closed near the open of the previous bar, so it does seem there is a large amount of bull interest here, but again, we need to be cautious as the bears may be allowing bulls to exit so they can get a better price. The weekly, not attached, closed a doji.
|
Joined Jan 2009
|
Status: Show me the pips!
|651 Posts
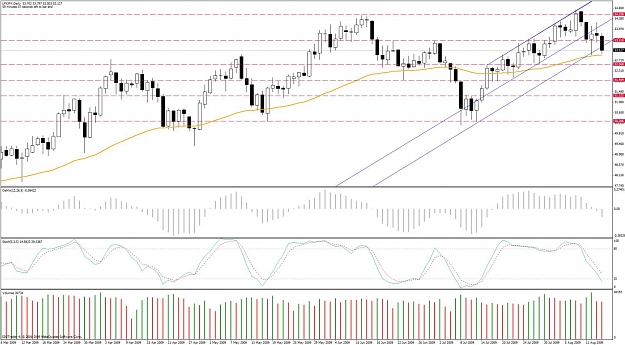
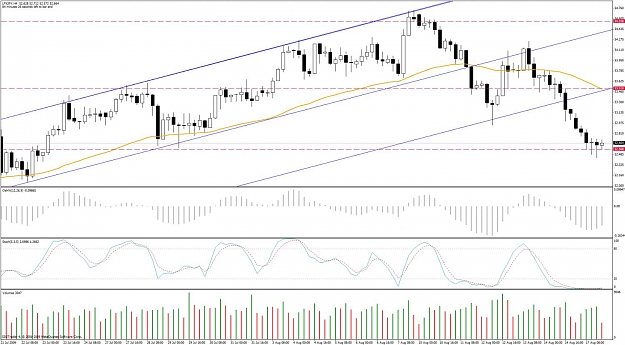
LFXJPY looks bearish.
The daily seems to be playing out the 3 inside down from earlier in the week, and on the weekly, we have a bearish engulfing, double top, at resistance. Immediate resistance is at the low of Wednesday's candle, and the orange line which is the 50 EMA.
Again, the japan gdp figures might make a fall happen sooner rather than later, or vice versa.
|
Joined Jan 2009
|
Status: Show me the pips!
|651 Posts
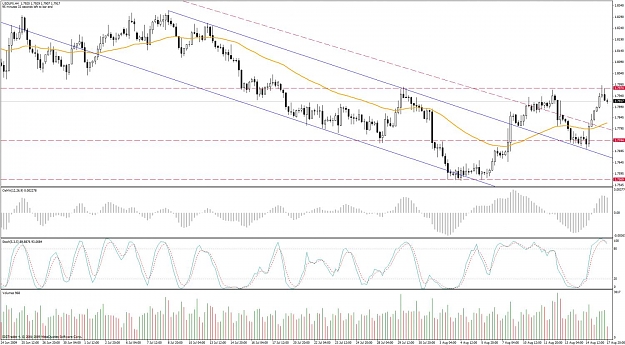
Well, seems like 1.80 is the line in the sand for usdlfx. We've tried to break it several times now, but the door seems to slam shut each time.
On the h4, we have a possible shooting star formation off the 1.80 resistance. On the plus side for the bulls, today's candle confirmed Friday's bullish engulfing and we opened and closed above the long term trendline sloping downwards. I can see 3 possible scenarios (talk about hedging your bets).
a/ If you believe in market symmetry, if you look to the far left of the h4, you'll see a smaller shoulder before we start the inverted H&S pattern, perhaps we'll get something similar this time around.
b/ We go down to test the decending trendline or the previous horizontal resistance
c/ We find dollar bulls from somewhere and break through 1.80.
If we do manage to break through resistance, next target would be 1.83, top of the previous trading range.
|
Joined Jan 2009
|
Status: Show me the pips!
|651 Posts
LFXJPY ran pretty much as expected today, don't see a reason why we wouldn't get more of the same tomorrow.
We've found some interest at a prior resistance, as indicated on the h4 chart, perhaps we'll see a retrace to the 53 area, which would coincide with the 12th August low.
|
Joined Jan 2009
|
Status: Show me the pips!
|651 Posts
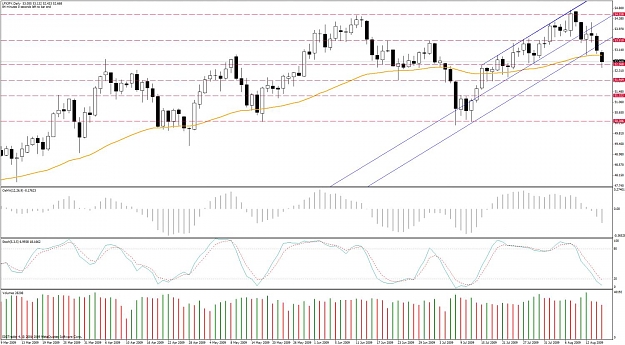
We found buyers on Friday, but today the bears covered Friday's wick. I think further movement south is possible, but we need to break 2.92 support. If that goes, next target would be 2.88.
what charts are you using?
I seem to like it better than those with metatrader..
They are much clearer and easier to understand..
where can I find them? is it also free?
Thanks,
Troy
Ignored
Hi Troy I use Trading station at fxcm.com
and Dealbook 360 at GFt www.gftforex.com
Joined Oct 2007
|
Status: Take The A-Trade
|2,303 Posts
Hi dear Traders!
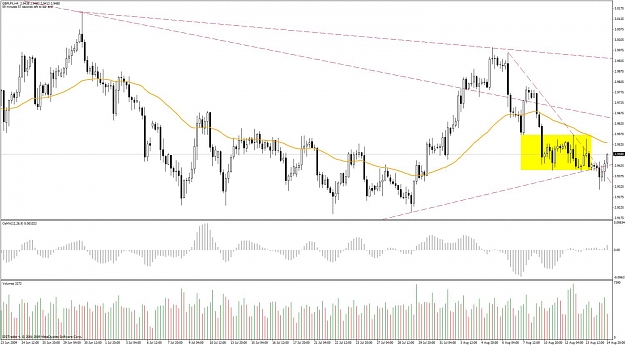
Long time no posting, I've been watching interesting things on GBPLFX index, I think is time to a correction and going long on GBP pairs, maybe until 2.92 is reasonable, chart:
Attached Image (click to enlarge)
What do you think?
Jhon
"THE ALL is Mind; the Universe is Mental--held in the mind of THE ALL."
Long time no posting, I've been watching interesting things on GBPLFX index, I think is time to a correction and going long on GBP pairs, maybe until 2.92 is reasonable, chart:
Long time no posting, I've been watching interesting things on GBPLFX index, I think is time to a correction and going long on GBP pairs, maybe until 2.92 is reasonable, chart: