Hello traders,
I'm sharing a very simple way to trade by Roger Baeting.
Soon I will code an EA with this strategy and share here, so for now, take a look and let me know ideas about it.
Regards,
My Trading Strategy with MACD and ADX (Forex Education)
By Roger Baettig On 08/31/10 AT 10:32 AM In my last week article Forex Trading with Fractals and ADX I explained what the ADX indicator is and how to use it for your trading.
In some other articles I explained what the MACD is and how you can set up trading strategies in combination with other indicators:
Trading with MACD (Forex Education)
My Forex Trading Strategy with MACD Divergence (Forex Education)
My Forex Trading Strategy with MACD & Stochastics (Forex Education)
Today I want to share with you a combination between the MACD indicator and the ADX. I use the standard setups for the MACD (12,26,9) and for the ADX (14) as well.
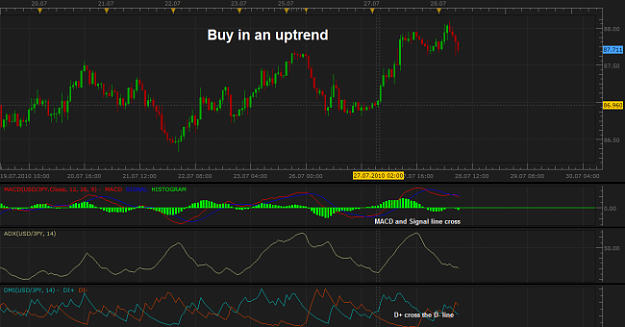
Buy in an uptrend
- The MACD indicator gives a buy signal.
- D+ crossed the D- line. Therefore the D+ line is above the D- line.
- The ADX line should be rising.
http://img.ibtimes.com/www/data/arti...7/28/15275.png
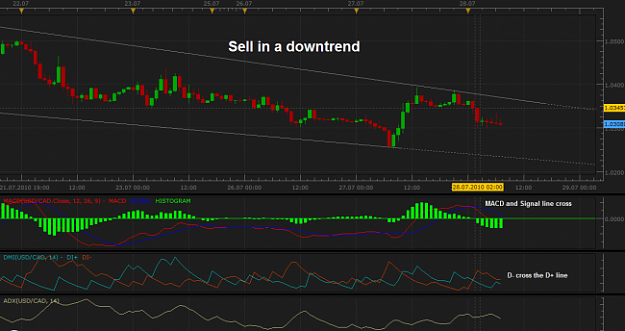
Sell in a downtrend
- The MACD indicator gives a sell signal.
- D- crossed the D+ line. Therefore the D- line is above the D+ line.
- The ADX line should be rising.
http://img.ibtimes.com/www/data/arti...7/28/15276.png
Stop loss
Use it as per your risk appetite.
Exit
Use trailing stops to exit because it will allow you to capture maximum profit.
One thing which is important while using this system is that you should trade with proper money management techniques.
Calculation
The Average Directional Index, or ADX, was developed by J. Welles Wilder to determine trend forces, whether the trend will grow on or will gradually lose its positions. This indicator lets analyze the market tendencies and make trading decisions in the Forex market.
In fact, ADX relates to the class of oscillators, which changes positions in a range from 0 up to 100. Though the indicator's fluctuations are in a range from 0 and up to 100, it seldom goes over a point of 60. If the value is lower than 20 demonstrates a weak trend, if the value is over 40 shows a strong trend. Position above 40 indicates both strong descending, and a strong ascending trend.
1 variant - calculation:
Calculation of positive and negative directed movement (Directional Movement or DM) - +DMj and -DMj
If Highj (a maximum of a current bar)> Highj-1 (a maximum of the previous bar),
That +DMj = Highj - Highj-1, differently +DMj = 0
If Lowj (a minimum of a current bar) < Lowj-1 (a minimum of the previous bar),
That -DMj = Lowj-1 - Lowj, differently -DMj = 0
If +DMj> -DMj,
That -DMj = 0
If -DMj> +DMj,
That +DMj =0
If +DMj = -DMj,
That +DMj =0, -DMj =0
Determination of the true range - TRj
TR = maximal module of three values
|High - Low |, |High - Closej-1 |, |Low - Closej-1 |.
Closej-1 - the close price of the previous period.
Note: In most cases module |High - Low| will be maximal on forex in absence of price breaks.
Determination of the indicator of a positive direction and the indicator of a negative direction - +DIj and -DIj (Directional Index). +DIj = Exponential Moving Averagej (+SDI, N) -DIj = Exponential Moving Averagej (-SDI, N) Where, if TRj not =0, That +SDIj = +DMj / TRj; -SDIj =-DMj / TRj If TRj = 0, That +SDIj = 0, -SDIj = 0,
Determination of the average directional index- ADXj
ADXj = Exponential Moving Averagej (DX, N) Where DXj it is calculated under the formula
http://www.forexrealm.com/forex-imag...ators/adx1.gif
Happy trading!
Roger
I'm sharing a very simple way to trade by Roger Baeting.
Soon I will code an EA with this strategy and share here, so for now, take a look and let me know ideas about it.
Regards,
My Trading Strategy with MACD and ADX (Forex Education)
By Roger Baettig On 08/31/10 AT 10:32 AM In my last week article Forex Trading with Fractals and ADX I explained what the ADX indicator is and how to use it for your trading.
In some other articles I explained what the MACD is and how you can set up trading strategies in combination with other indicators:
Trading with MACD (Forex Education)
My Forex Trading Strategy with MACD Divergence (Forex Education)
My Forex Trading Strategy with MACD & Stochastics (Forex Education)
Today I want to share with you a combination between the MACD indicator and the ADX. I use the standard setups for the MACD (12,26,9) and for the ADX (14) as well.
Buy in an uptrend
- The MACD indicator gives a buy signal.
- D+ crossed the D- line. Therefore the D+ line is above the D- line.
- The ADX line should be rising.
Attached Image (click to enlarge)
http://img.ibtimes.com/www/data/arti...7/28/15275.png
Sell in a downtrend
- The MACD indicator gives a sell signal.
- D- crossed the D+ line. Therefore the D- line is above the D+ line.
- The ADX line should be rising.
Attached Image (click to enlarge)
http://img.ibtimes.com/www/data/arti...7/28/15276.png
Stop loss
Use it as per your risk appetite.
Exit
Use trailing stops to exit because it will allow you to capture maximum profit.
One thing which is important while using this system is that you should trade with proper money management techniques.
Calculation
The Average Directional Index, or ADX, was developed by J. Welles Wilder to determine trend forces, whether the trend will grow on or will gradually lose its positions. This indicator lets analyze the market tendencies and make trading decisions in the Forex market.
In fact, ADX relates to the class of oscillators, which changes positions in a range from 0 up to 100. Though the indicator's fluctuations are in a range from 0 and up to 100, it seldom goes over a point of 60. If the value is lower than 20 demonstrates a weak trend, if the value is over 40 shows a strong trend. Position above 40 indicates both strong descending, and a strong ascending trend.
1 variant - calculation:
Calculation of positive and negative directed movement (Directional Movement or DM) - +DMj and -DMj
If Highj (a maximum of a current bar)> Highj-1 (a maximum of the previous bar),
That +DMj = Highj - Highj-1, differently +DMj = 0
If Lowj (a minimum of a current bar) < Lowj-1 (a minimum of the previous bar),
That -DMj = Lowj-1 - Lowj, differently -DMj = 0
If +DMj> -DMj,
That -DMj = 0
If -DMj> +DMj,
That +DMj =0
If +DMj = -DMj,
That +DMj =0, -DMj =0
Determination of the true range - TRj
TR = maximal module of three values
|High - Low |, |High - Closej-1 |, |Low - Closej-1 |.
Closej-1 - the close price of the previous period.
Note: In most cases module |High - Low| will be maximal on forex in absence of price breaks.
Determination of the indicator of a positive direction and the indicator of a negative direction - +DIj and -DIj (Directional Index). +DIj = Exponential Moving Averagej (+SDI, N) -DIj = Exponential Moving Averagej (-SDI, N) Where, if TRj not =0, That +SDIj = +DMj / TRj; -SDIj =-DMj / TRj If TRj = 0, That +SDIj = 0, -SDIj = 0,
Determination of the average directional index- ADXj
ADXj = Exponential Moving Averagej (DX, N) Where DXj it is calculated under the formula
http://www.forexrealm.com/forex-imag...ators/adx1.gif
Happy trading!
Roger