I posted this but till now got no answer which is confusing me:
Could someone please check slide 24 in the powerpoint presentation and tell me why he did not draw a vertical line through the blue candle with the highest peak to determine the intersection point with the demand trend line. But instead uses the red candle after the blue one to determine the intersection point. He does that often in the slide show.
<!-- / message -->In fact if you compare powerpoint slide 24 with 40 you will see that he uses different candles to find intersection point.
Ignored
It appears that slide #24 and slide #40 are the same trade. It looks like #40 follows the document. It also appears that slides #18 and #29 are the same trade with different projections.
Maybe Mouteki tried to rush us the documents, and made some minor blips in the process. No harm done....
Joined Mar 2006
|
Status: THANK YOU MERLIN,TWEE and FF Team
|4,603 Posts
Yea yea yea, I already admitted my mistake. After only 55 years, I am just now beginning to tackle the advance subject of right and left... Minute, what I meant was your other left... LOL Scott
Quoting minute
Disliked
No. In this system trendlines are drawn from right to left connecting 2 points.
the first point would be on the right of the chart.
the second point would be on the left.
A point 14 candles from the second point, starting from the second point.
14 candles from the second point in a rightwards direction is another valid point.
Joined Sep 2005
|
Status: J16 Senior Member
|13,635 Posts
Quoting Thebigmo
Disliked
In this congested forum, finding a specific post is like winning a lottery.
Ignored
I think mono was referring to post#483. Which had nothing to do with your question bigmo. We just want to know if we are following the rules correctly.
Am I right bigmo?
Jim
Indicators show the past. Price Action "Indicates" the future.
I think mono was referring to post#483. Which had nothing to do with your question bigmo. We just want to know if we are following the rules correctly.
Am I right bigmo?
Jim
Ignored
Yeah, sorry all I was referring to the system in general
I think mono was referring to post#483. Which had nothing to do with your question bigmo. We just want to know if we are following the rules correctly.
Here is a nice Fractal Indicator for those of you interested in using it. You can adjust the number of candles to the left and to the right of the swing high or swing low. I believe it is set to 2 candles so it works fine with the Mouteki method.
Ignored
it works... this indicator helps to identify peak and bottom perfectly..
Carmel,
Can you post your chart? I don't see the short. I think we are waiting for a support candle to form so we can move our demand line up closer to the current price.
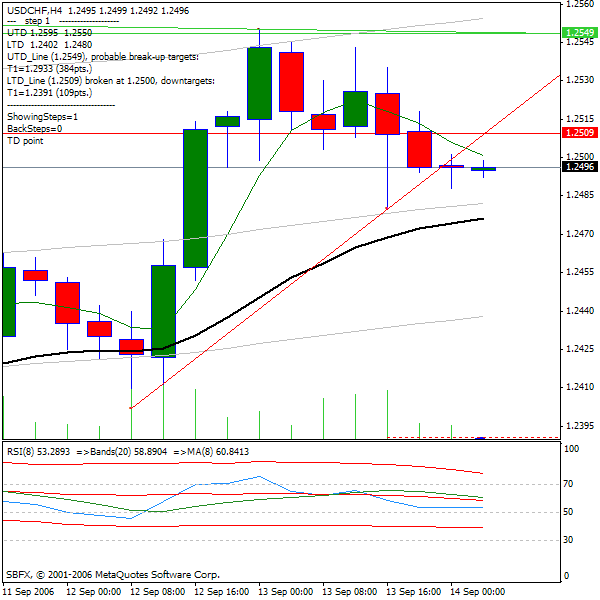
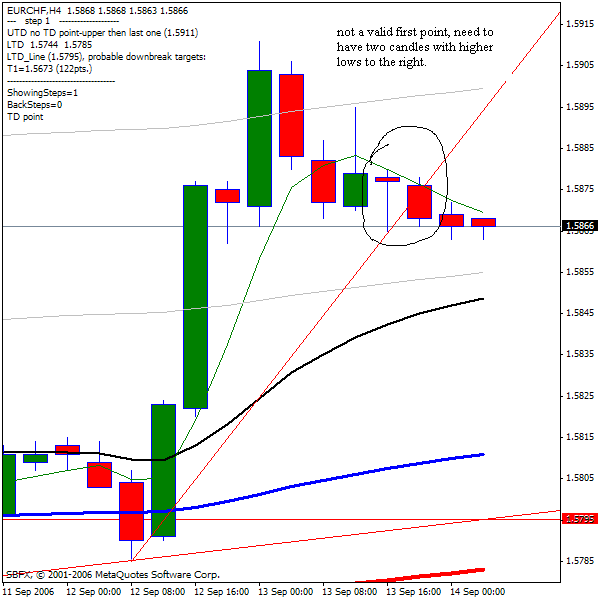
just noticed you were talking eur/chf... which i dont normally look at... stick to 5& under spreads... I had just gone short on the usd/chf... I dont see a short trade yet in eur/chf tho? needed a 2nd higher candle right of the trend and didnt get it...
I guess I need a primer in posting charts, but my trend line is with the "demand" (upward trend line) from the 9/12 0:400 candle to the 9/13 12.00 candle, as recorded on the VT Trading platform. MT4 shows the same. Comments?
"Loss and failure are inevitable but misery is optional"
well heres my chart. I think its still a valid trade... got a little pinbar action... but according to the method in this thread, have to have two higher lows on each side of your trend point... which is not the case on my chart... of course your chart may differ....
first of all i want to thanks mouteki for the great sharing method and all of people here for the great contributions..
as a newbie here i really apreciate it.
after studying the method, i a bit confused on how to decide which line i'm gonna use (the demand line or the supply line?) if that 2 line is coincidence can be draw (from right to left, right?)in the same time, is that any special rule for that situation? or should i wait on which line the open will happen for the following next bar..
well heres my chart. I think its still a valid trade... got a little pinbar action... but according to the method in this thread, have to have two higher lows on each side of your trend point... which is not the case on my chart... of course your chart may differ....
Trev
Ignored
doen't look right, if you look at the LTD points the line doesn't match up, remove the indicator and re-apply it.