This is a system I created over the weekend. I call it Polyjuice Potion, after the shape-shifting potion from Harry Potter, because its main ingredient is the genius of Mr. Mladen, a programming and trading wizard, famous for his many selfless contributions to the retail community, and this system, will hopefully transform you into something that at least on the surface, looks just as clever.
I created this system specifically to use in the Testing Club thread as the first test subject.
Obviously since I just created this system I haven't had a chance to properly test it or even vouch for its performance in live trading. Please don't use it on a live account!
Disclaimer: Use at your own risk; I'm not responsible for your losses or inability to read or think, yadda yadda.
If you're curious how it performs in real trading, feel free to test it and report your findings over at the Testing Club. I will be testing it this week and will update this post to report on its performance, real and simulated.
This is my first time posting a system on FF. I have my own way of explaining things, that makes sense to me, but I'm not sure if it will make sense to you. Please ask for clarifications if something is vague, or illogical. Constructive feedback always appreciated.
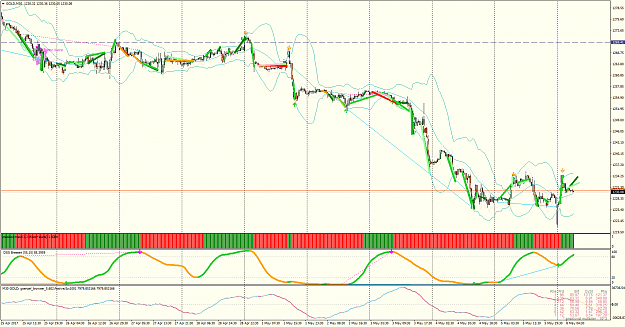
Performance
I'll be updating this section but here is a quick (gold) chart marked up with some theoretical trades that would have been made according to the system rules. Green lines are successful trades. Red, orange and salmon lines are failed trades. As you can see, the green outnumbers and outdistances the other lines, so it has some promise. In theory.
System description and rules
Polyjuice Potion
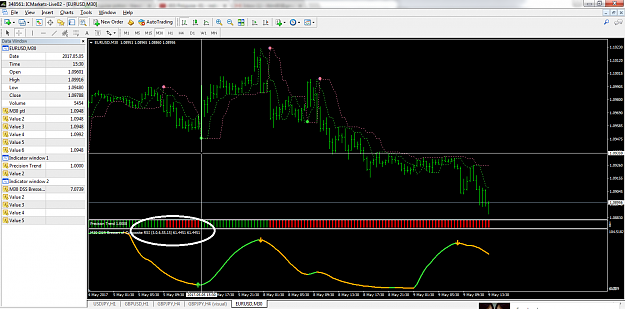
Rationale: This system has 4 indicators. Two are trend indicators, one is a volatility indicator (Bollinger) plus Bressert which can show trend, but also indicates overbought/oversold conditions of an instrument. It's often not a a good idea to use this many indicators in one system, but since this is a test of a testing system, using this many indicators has the benefit of giving some insight into the relative performance of each of these indicators, maybe singling one or two out as overachievers. In this system the trend indicators give entry and exit signals, while the bands give exit signals.
There are 3 entry conditions, and 8 exit conditions, reflecting the importance of exits over entries. For the most part, the most common and important exit, is the bollinger band exit, and so the most important rule (3.2) is the one that defines when to re-enter a trade after being taken out by a band-crossing. That rule's settings are fairly arbitrary and the most optimization can probably happen there.
Money management is dead simple, maybe moronically simple for this system. Some sophistication could probably be added to it, including adding conditions when trading during ob/os or when there is agreement/disagreement between the indicator signals. For now though, finding out which signals are reliable in which conditions is the priority.
Timeframe: M30
Instrument: Any
Indicators: Courtesy of mladen - although he may not have invented these indicators (maybe precision-trend?), he coded them expertly for both mq4 and mq5. If you have any background info on these indicators it is much appreciated.
- Perfect Trend Line v.7 (mladen)
- Precision Trend 2.2 (mladen)
- Double Smoothed Stochastic Bressert 2.03 (mladen)
- Bollinger bands (2.8 std dev, 20 period)
Optional: Goertzel browser to set the period. However start with default settings (except where shown above) and optimize from there.
Entry:
- Enter on a signal from any of the three indicators (!)
- Avoid entering with less than 4 hours remaining in a day.
- If the signal candle pierced the bollinger band in the desired direction (or is unusually tall - more than 1ATR), wait to confirm wall-climbing before entry, otherwise, expect a bounce, and enter only after two confirming candles - see 3b.
Exit:
- Exit on that signal’s indicator signal.
- When price grazes/exits the correct side of the bollinger band. For a band exit, wait until price begins retracing before exiting.
- Re-enter after a band exit if indicators are still supportive:
- When price on the very next bar resumes the correct direction. (wall-climbing)
- On the second confirmation bar during a consolidation. So
- price will bounce off the third band in the wrong direction,
- eventually it will return and one bar (usually substantial) will confirm return to the trend,
- then one or two contrary bar(s) (usually smaller) might add to consolidation. If there are more than 2, reset the count.
- then the second confirming bar will add to consolidation,
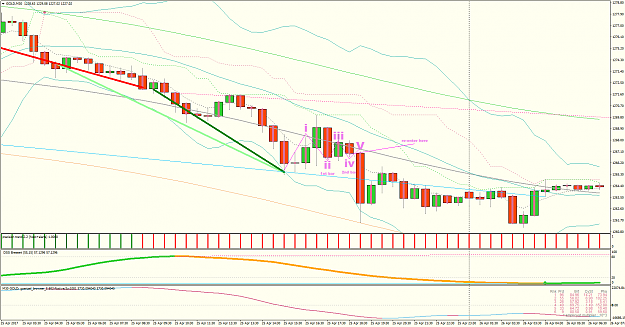
- and on or just after that bar, you re-enter the trade in the indicator’s stated direction. (See Fig. 1)
Attached Image (click to enlarge)
Fig. 1Fig. 1 - note that all 3 indicators are still flashing short signals at time of entry.
- Note: PTL has 3 modes - buy/sell/neutral. Exit on neutral when the trade is profitable. If it turns neutral on an unprofitable trade, wait until it turns to buy/sell. If it changes to the opposite signal, exit, and if it re-confirms the initial signal, remain in the trade (but do not add a new position).
- Exit a profitable trade if it crosses the wrong side of the bollinger midpoint line (moving average). Re-enter if price crosses and closes on the correct side.
- If price approaches very near the bollinger band and then closes away from it aggressively on the next candle (failed rally).
- Exit a profitable trade (breaks through 1ATR) if it retraces more than 75%
- Exit all positions at the end of the week, no matter what.
Stops: Virtual only, set alerts at 2x the distance of the PTL dot to the opening price of the bar on which it appears(I assume it’s a PSAR?) or if that dot isn’t yet present for that signal, at the 3rd band +20%.
MM: Ideally we'd use Hurst Cycles to determine the cycle quadrant that we're currently in, and use that to determine the underlying trend, then trade larger positions when the trend is accelerating, but since that would triple the length of this explanation, we'll just use the H4 timeframe to look at the dominant trend. If you look at gold now you'll see that the trend is clearly down. The money management rules are very simple.
- Trade 0.05 lots per $1000 balance for trades counter to the dominant trend
- Trade 0.1 lots per $1000 balance for trades that are aligned with the dominant trend.
- update: I should mention you'll have at most 3 trades open at a time with this version of the system. So the most leverage in use will be 0.3 lots per $1000 balance, which is high ~ 6% equity risk depending on the size of the s/l. However this system uses no grids, no martingale or other inherently risky strategy. On the other hand the stops are quite loose, and so a failed trade will be significant if it happens during a trend reversal. For larger accounts or for more conservative traders just reduce the ratio. You could use 0.01 per $1000 as many do, or some multiple of that.
That should be good for now. Let me know if I missed something important. I will update this with simulated and forward demo test results.
Update1: added template file and goertzel browser indicator - note that goertzel doesn't play nicely with templates. It's better to remove and re-add it to the chart.
Update 2: replaced DSS with correct version, replaced template with a possibly cleaner file.