QAM-1000-Live MT5
The template (will likely be modified a little as time goes on, either adding or deleting some of the indicators) is as follows:
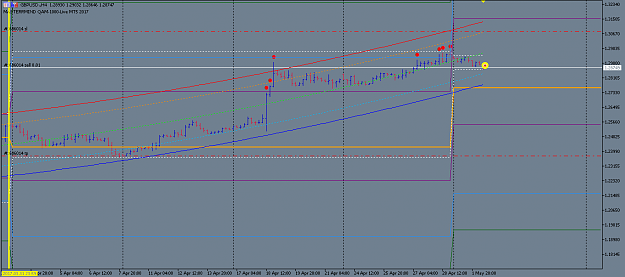
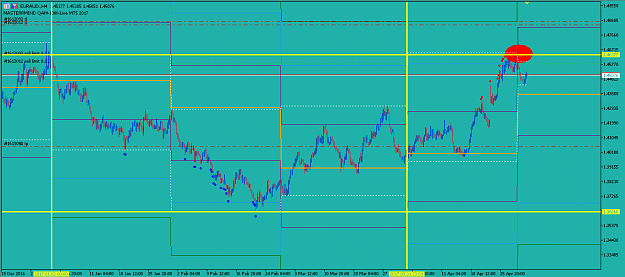
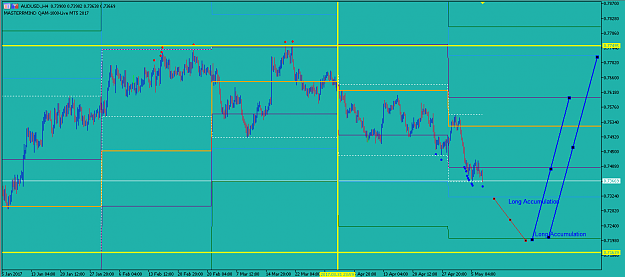
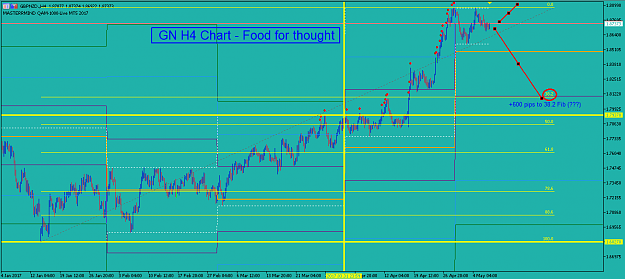
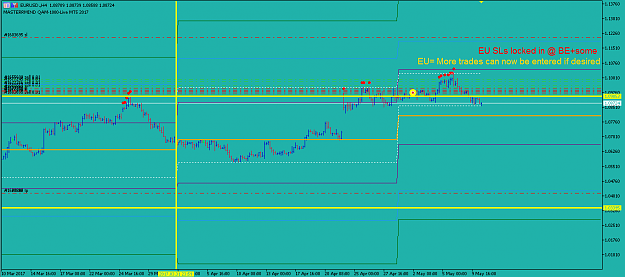
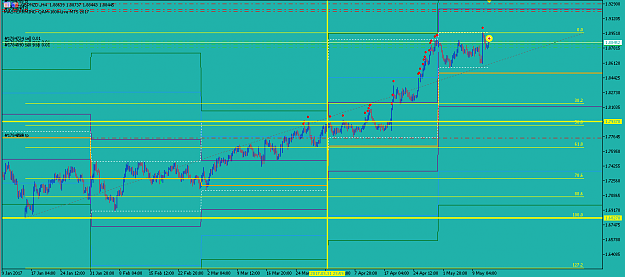
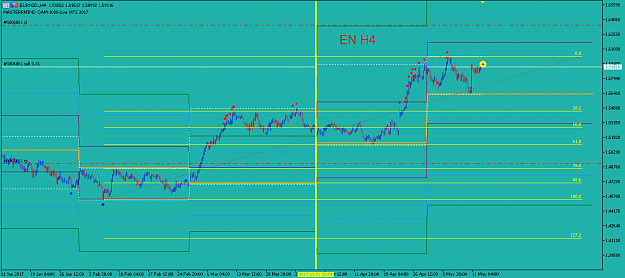
Yellow vertical lines create manual borders for the quarterly period (start of year through to 31 March 2017).
Yellow horizontal lines lock in the highs and lows of the previous quarter.
A monthly high and low indicator is applied (dashed white lines).
A Quantum indicator is used that shows blue and red dots (or boxes) that represent user defined look back periods.
Quantum (Q) values for the H4 TF are 384 (you shouldn't take long to realize what this value represents).
The colored arcs are the center of gravity plots (I'll explain what this means later).
The solid and dashed colored horizontal lines represent the monthly pivot, support and resistance zones.
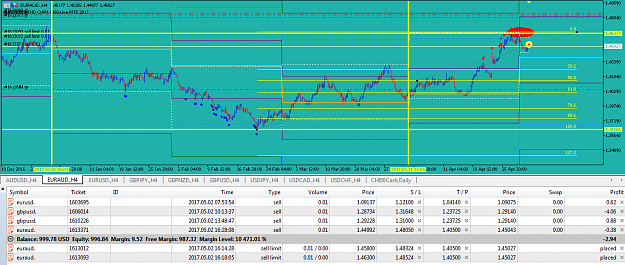
Note that H4 generated trades will be manual but mostly taken from plots of the Quantum red and blue dots.
Stops will be wide.
Lot sizing will be CLS (constant lot size - manual only initially) and minimal size at only 0.01 lots per trade.
Trade count will be limited in total and per given pair.
Pair choose may come from any instrument found in the XM Markets MT5 platform.
TPs will be smallish with an approach to lock in at BE + some pips when price moves a pre-determined distance (either in pips or based on chart structure, pivot points, S+R ot Fibonacci ratios).
I will introduce the Dynamic Trading Frame (DTF) in later posts.
I will also introduce some minor Gann analysis tools mainly the trendline angles and how I will apply them to QAM.
H4 or in particular HTF trading requires some fundamental analysis so it too will form part of QAM.
More to come .............
Masterrmind............
The template (will likely be modified a little as time goes on, either adding or deleting some of the indicators) is as follows:
Attached Image (click to enlarge)
Yellow vertical lines create manual borders for the quarterly period (start of year through to 31 March 2017).
Yellow horizontal lines lock in the highs and lows of the previous quarter.
A monthly high and low indicator is applied (dashed white lines).
A Quantum indicator is used that shows blue and red dots (or boxes) that represent user defined look back periods.
Quantum (Q) values for the H4 TF are 384 (you shouldn't take long to realize what this value represents).
The colored arcs are the center of gravity plots (I'll explain what this means later).
The solid and dashed colored horizontal lines represent the monthly pivot, support and resistance zones.
Note that H4 generated trades will be manual but mostly taken from plots of the Quantum red and blue dots.
Stops will be wide.
Lot sizing will be CLS (constant lot size - manual only initially) and minimal size at only 0.01 lots per trade.
Trade count will be limited in total and per given pair.
Pair choose may come from any instrument found in the XM Markets MT5 platform.
TPs will be smallish with an approach to lock in at BE + some pips when price moves a pre-determined distance (either in pips or based on chart structure, pivot points, S+R ot Fibonacci ratios).
I will introduce the Dynamic Trading Frame (DTF) in later posts.
I will also introduce some minor Gann analysis tools mainly the trendline angles and how I will apply them to QAM.
H4 or in particular HTF trading requires some fundamental analysis so it too will form part of QAM.
More to come .............
Masterrmind............
Master your Mind then Master your Trades