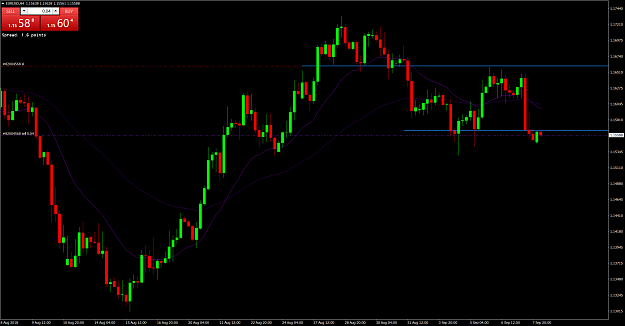
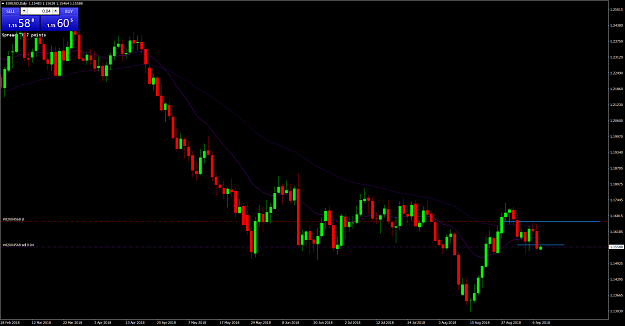
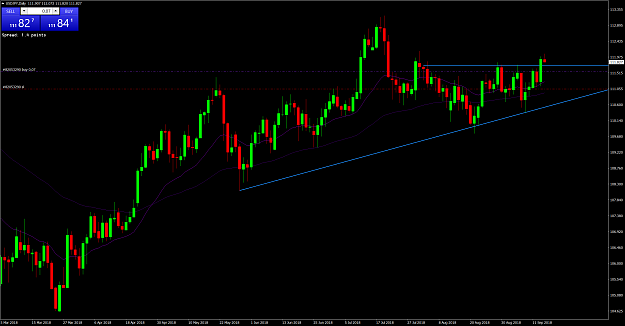
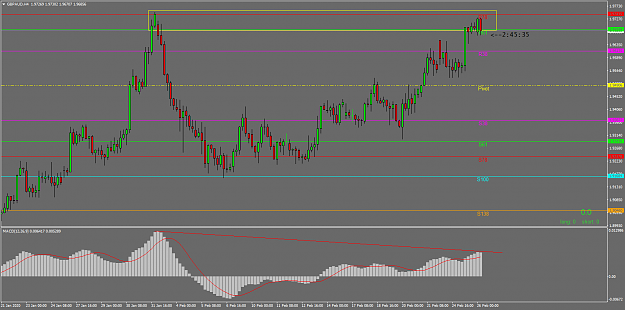
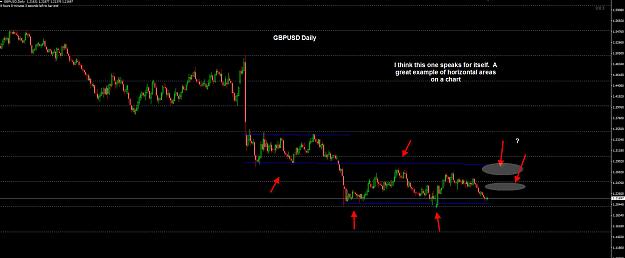
DislikedGBPUSD daily. I think this one speaks for itself. A great example of simple horizontal levels on a chart and how price reacts around these levels. Wait for a pullback to a key level or a break lower and retest of support once broken. {image}Ignored
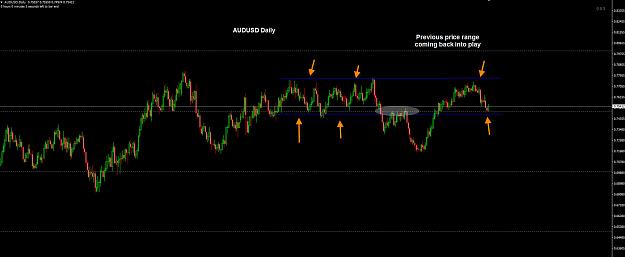
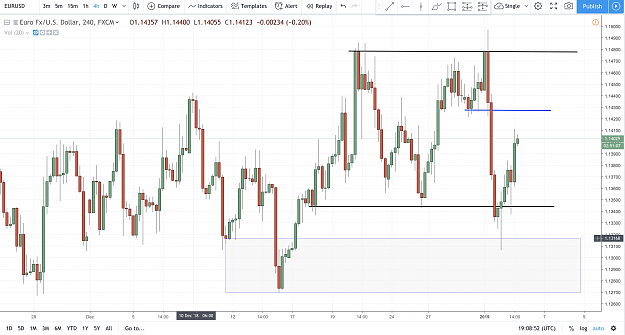
Clear horizontal areas coming into play here.
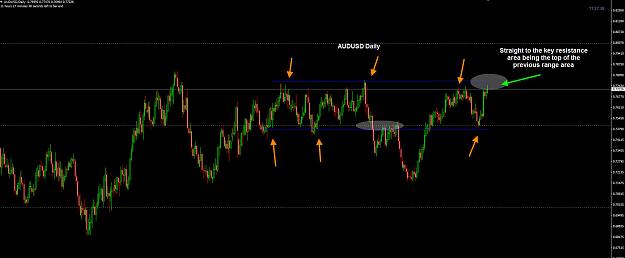
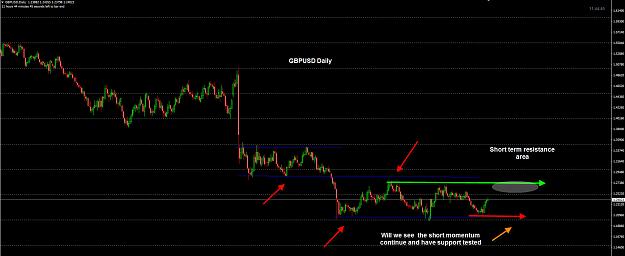
Price reached the first key resistance area.
Now to see if it completes a move to the top end of the range or continues the short momentum back towards support
Attached Image(s) (click to enlarge)
Twitter - DarkWolF@OzForexTrader - Facebook Page - link in post 1