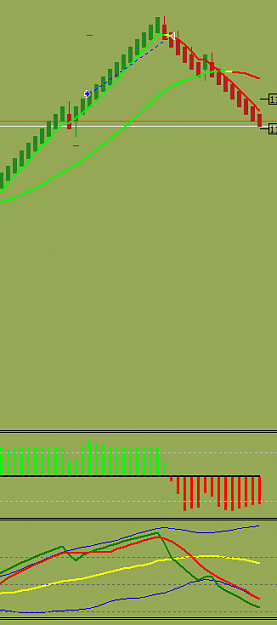
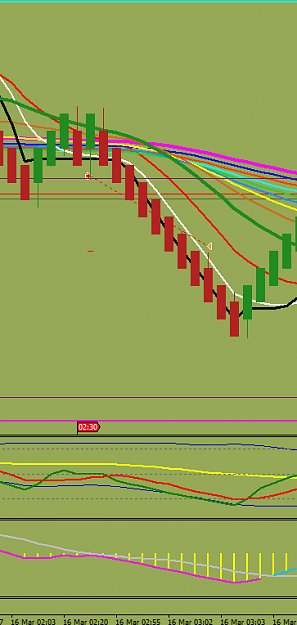
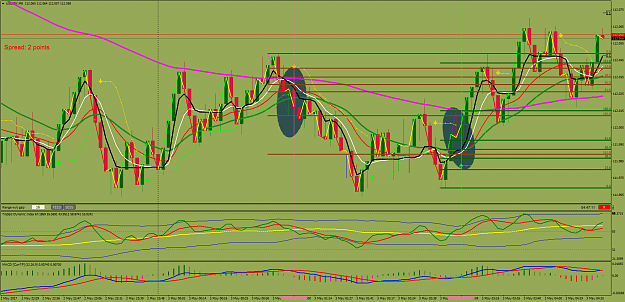
Thank you Sydney.
Made my percentage for the day.
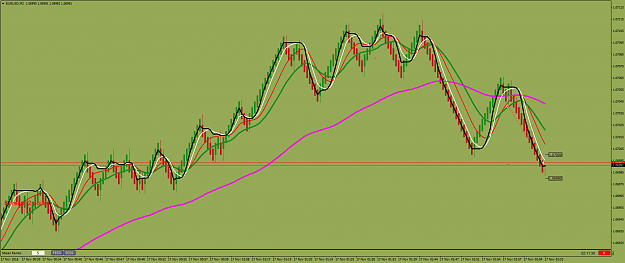
Large renko was turning.
Small renko made a pullback. Note the head and shoulders formation. Also that the TDI was giving a head and shoulders with divergence on second shoulder. Entered on the break and had a very close following stop to get the max out of this move.
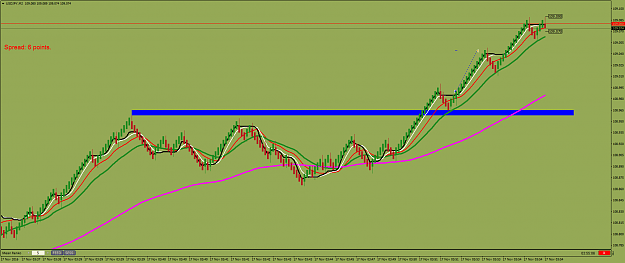
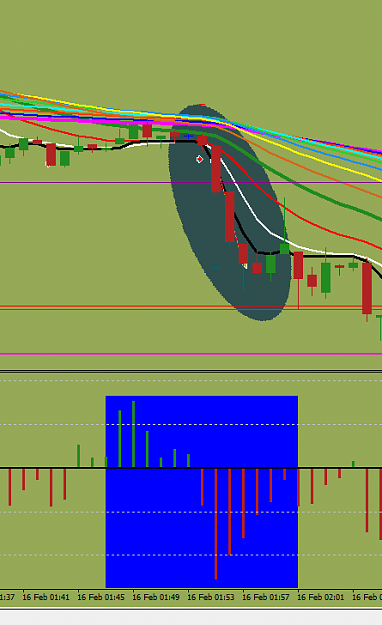
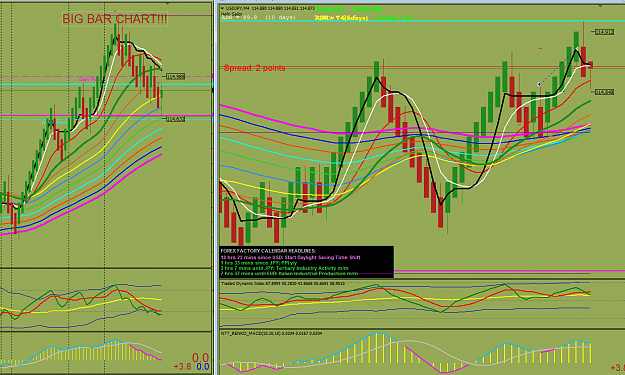
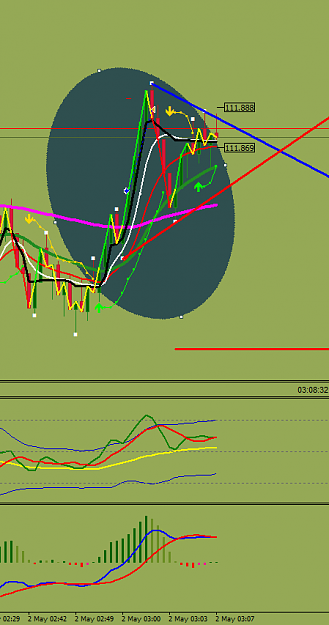
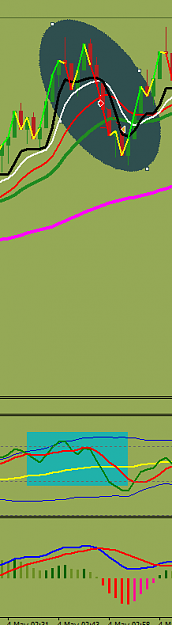
Scalping on 1 min chart USD/JPY. Just prior Tokyo Open.
What's the rainbow say? Down bias!
What the CCI doing? Coming off oversold level. So expect down move.
Wait for red candle to close below black VMA.
Enter on next candle at break of previous candle plus spread. SL just above entry candle this was 3.5pips.
After entry watch CCI. Note it went oversold quickly so trail stop closely. TP was 6.8pips. Profit was 1.9 times as big as risk.
Just the way I like it.
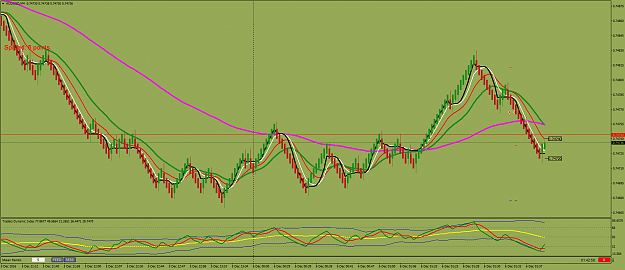
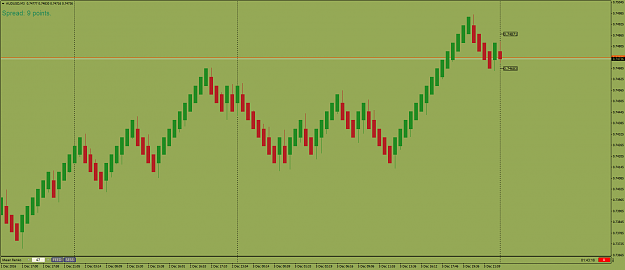
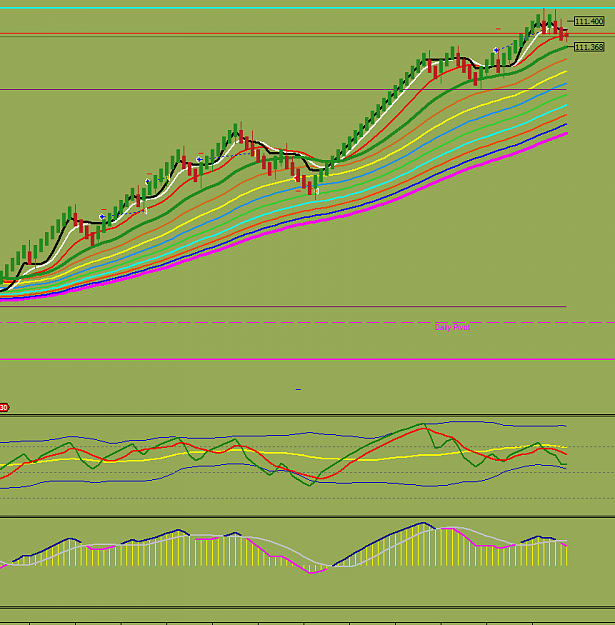
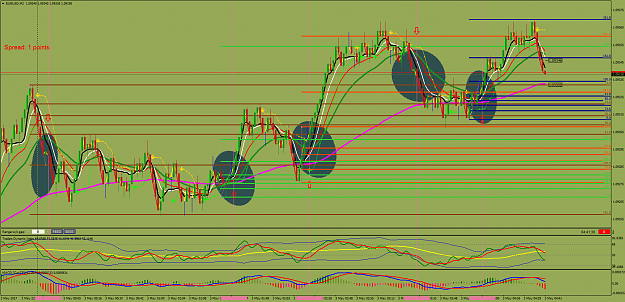
So after what amounts to many days of testing I've gone back to constant range bar charts.
They give a much truer perspective of price action than renko or time based charts. It's like an X-Ray picture of price.
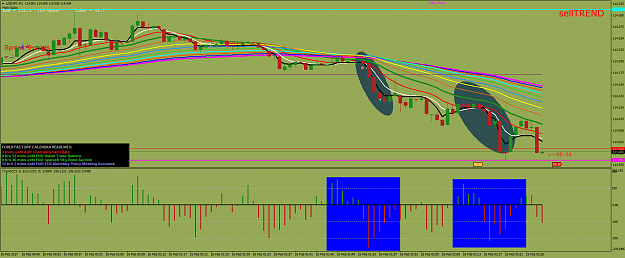
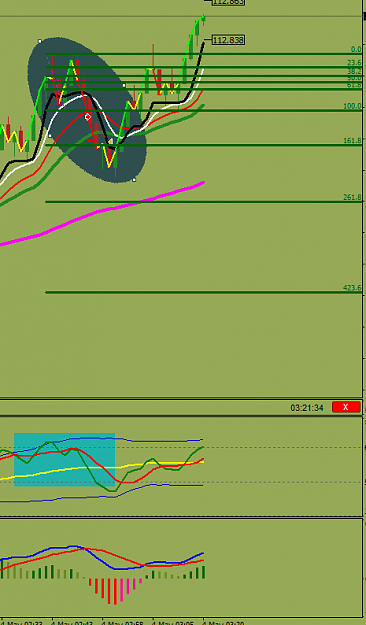
I trade pullbacks. CRB charts show that VERY clearly. Here's this mornings USD/JPY trade. It's so clear!
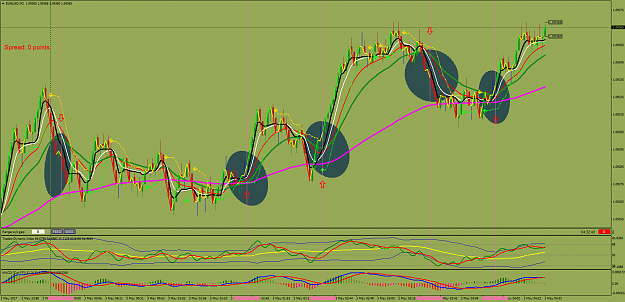
These are what I call "Nip and Tuck" trades.
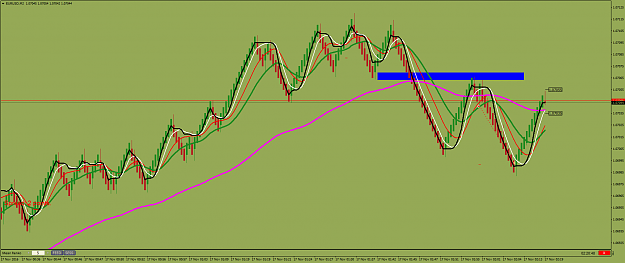
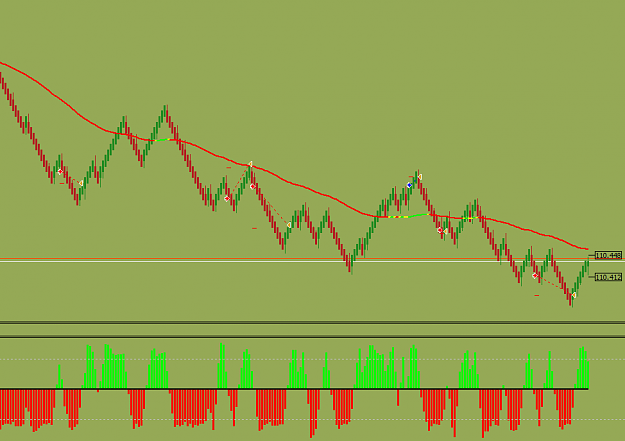
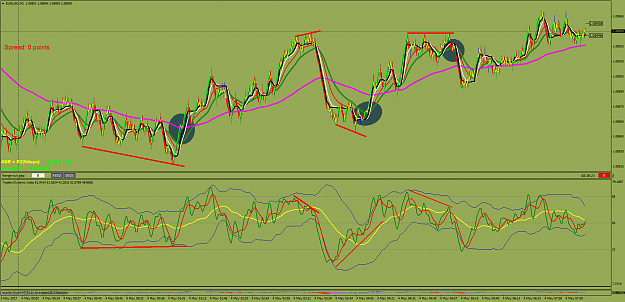
Look at EU CRB chart. (Range 8 points)
5 little scalps highlighted. Prices tucks into the rainbow but doesn't cross it. Just a small pullback into the current trend. The LWMA (set to 1) shows the most clearly (I've put chart to background to see this.)
Now apply a fib to each signal. (a bit confusing on this crowded chart) They all make it at least to the 161.8 level which would make a great 1st target level.