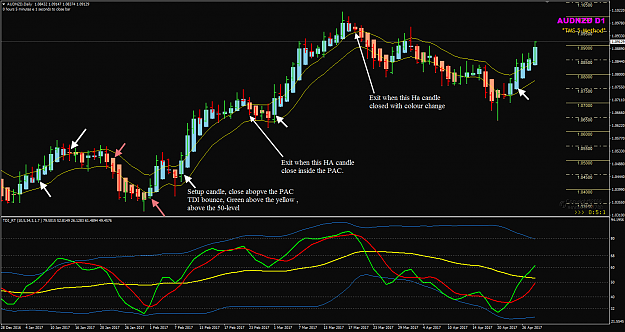
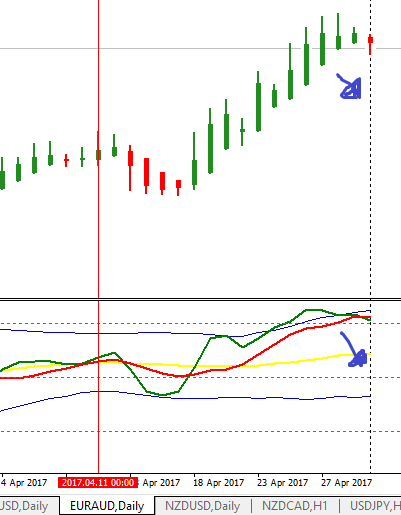
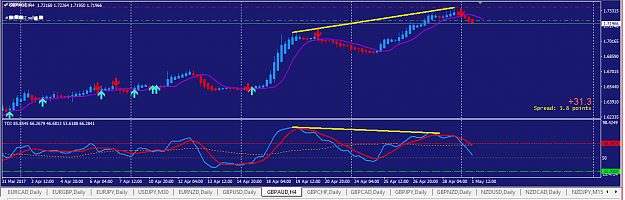
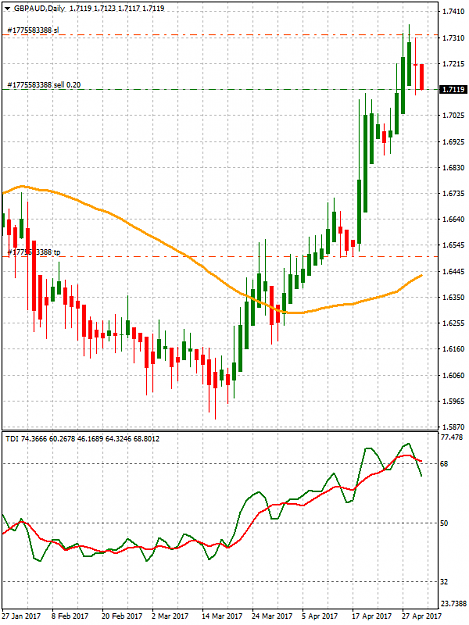
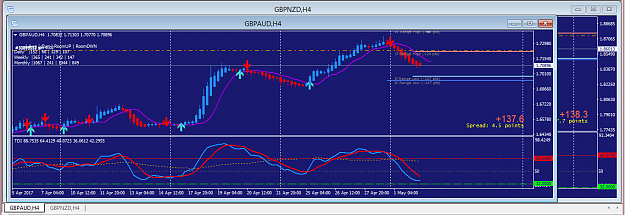
Disliked{quote} {quote} Here are 2 charts -MN and D1 to show what I meant by the D1 candle which closes across the MN Historical swing level is a big body candle. I trade using these MN swing levels. Trade the price as it move from one level to the next level, use the levels to find trade setups and target the next levels. {image} {image} This week we have month end clsoing. After today NY close, we update our Big Picture Plan BPP and plan our trades for next month.Ignored
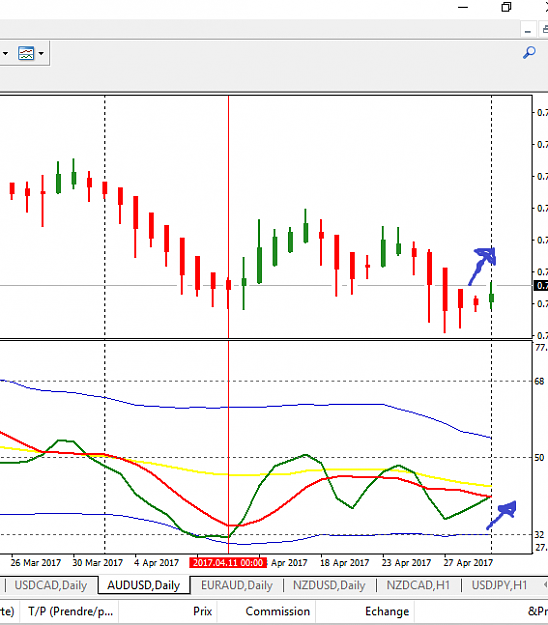
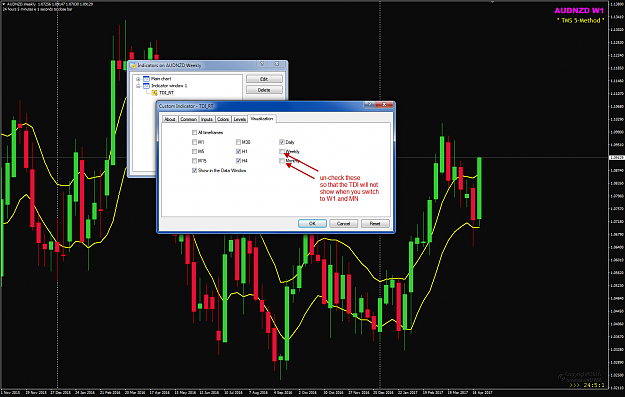
This is to reply one PM asking for my chart template in this post above. I have only one chart template and what I see is by using the properties setting of the indicator.
For example, I do not look at the TDI on Weekly and Monthly, I simply un-check the timeframe box.
Attached Image (click to enlarge)
Honesty is a very expensive gift. You wont find it in cheap people.WBuffett
1