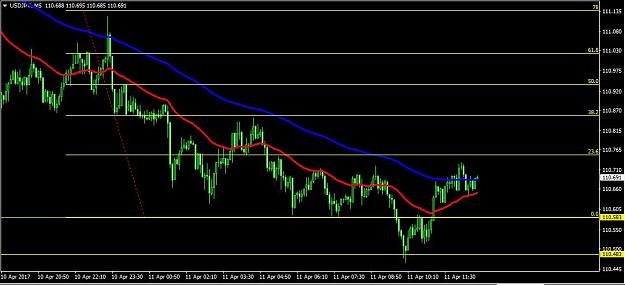
but with the calculation with kprsa's Pivot indi I get other S/R lines/numbers like with your original one (pic 1 & 2) {image} {image}
Ignored
Looks like there is an additional different Zscore number (1.28?) in the original indicator to me. I used the values (1, 1.645, 1.96, 2.576) from the post #165.
Hello GTH,
I find your approach very interesting, many thanks. I have afterwards 3Positionen open-to the testing. Now patience, let's see what happens.
{quote} Looks like there is a additional different Zscore number (1.2?) in the original indicator to me. I used the values (1, 1.645, 1.96, 2.576) from the post #165. Cheers, k
Ignored
Exactly kprsa.. That is my bad.. I just missed putting the value 1.28 in the explanations.. Sorry for that..
Since you wrote I have a question:
On daily time frame, the calculation of the volatility for the past can not be correct I think. I am not a coder but the following line should not be sufficient to calculate the past..
double atr=iCustom(Symbol(),PERIOD_M5,"ATR-Close",1440,0,i); //iATR(Symbol(),PERIOD_M5,1440,i);
It would be correct for the 5 minute time frame though..
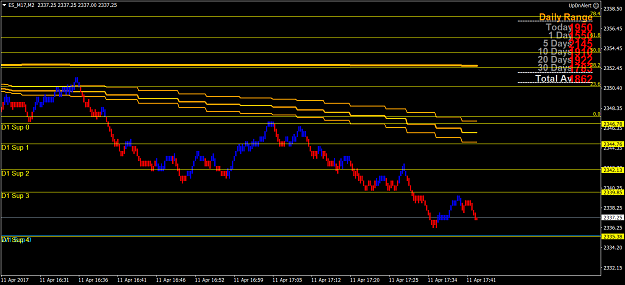
{quote} Can You look on your chart on UJ? Now on 23,6 will be good entry for long ? {image}
Ignored
I generally don't trade pairs. But to me UJ is heading south, so if the daily time frame is heading south too, I would wait for a retracement towards 50 then enter short, targeting 0 (Sup0),.. But this is my view...
{quote}On daily time frame, the calculation of the volatility for the past can not be correct I think. I am not a coder but the following line should not be sufficient to calculate the past.. double atr=iCustom(Symbol(),PERIOD_M5,"ATR-Close",1440,0,i); //iATR(Symbol(),PERIOD_M5,1440,i); It would be correct for the 5 minute time frame though.. Please advise.. Thanks...
Ignored
Yes, you're right. The indicator is written for the TF=5 min only. It would be slightly more complicated if one wanted to use it in other TFs (so MTF type indicator).
Specifically the problem is here:
The iterator i is TF-dependent. I'll see how to try to sort this out.
Note also that to use this on daily TF one will need to have many candles in the M5 graph...
{quote} Yes, you're right. The indicator is written for the TF=5 min only. It would be slightly more complicated if one wanted to use it in other TFs (so MTF type indicator). Specifically the problem is here: double atr=iCustom(Symbol(),PERIOD_M5,"ATR-Close",1440,0,i); The iterator i is TF-dependent. I'll see how to try to sort this out. Note also that to use this on daily TF one will need to have many candles in the M5 graph... Best, k
Ignored
Hi kprsa,
Thank you for your input. I totally agree that it would be complicated task and correct calculation needs huge amounts of 5 minute bars.
I think it is better to leave it like this without further complicating it for you. I truly appreciate your inputs.
Is there any reason you can think of that this couldn't work on a Mean Renko charts (which are offline charts) - i know you said use on a 5m chart, just wondering if thats because of the technical makeup of the indicator or some other reason.
I will test anyway but thought i would ask the question
Is there any reason you can think of that this couldn't work on a Mean Renko charts (which are offline charts) - i know you said use on a 5m chart, just wondering if thats because of the technical makeup of the indicator or some other reason. I will test anyway but thought i would ask the question
Ignored
I use it on offline range bars and it works fine, but you have keep an open 5 minute chart of the same pair in mt4. Otherwise calculation might get wrong..
{quote} I use it on offline range bars and it works fine, but you have keep an open 5 minute chart of the same pair in mt4. Otherwise calculation might get wrong.. Good Luck...
{quote} I use it on offline range bars and it works fine, but you have keep an open 5 minute chart of the same pair in mt4. Otherwise calculation might get wrong.. Good Luck...
Ignored
hey GoldTheHun, can you please show a couple charts of your system on range bars, it could be interesting for some of us. Thanks
{quote} hey GoldTheHun, can you please show a couple charts of your system on range bars, it could be interesting for some of us. Thanks
Ignored
Sure metta,
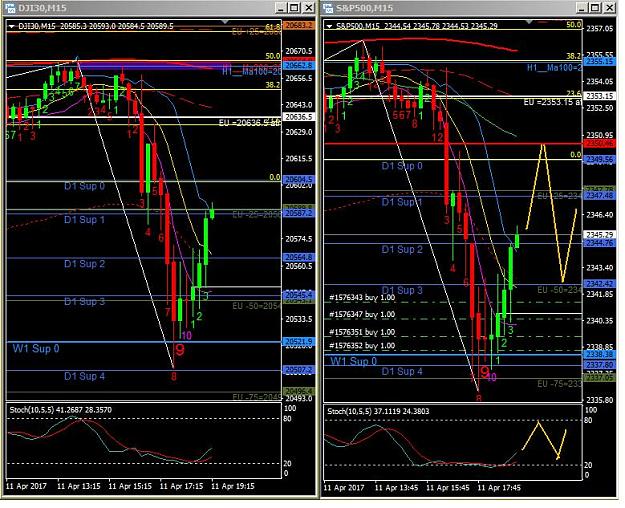
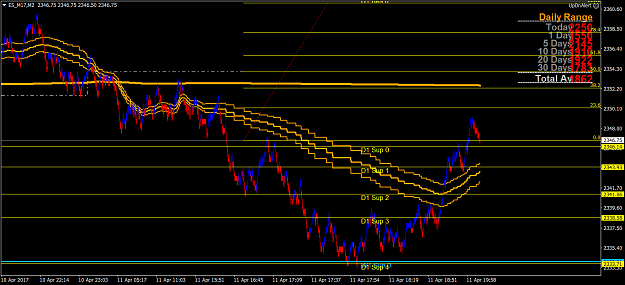
Since I only trade sp500 for a long time now, here is pic of my chart. Range bars are 0.50 in height.
Attached Image (click to enlarge)
Red and blue bars come from 3 line break indicator and the 3 orange lines are mtf ma, set at 5 minute timeframe and they are ema37 of close, high and low.
And this is it. I don't believe in crowded charts. So this gives me what I want..
As you can see the price respects these levels very much.
I would like to see the price hesitate on a level before I enter.
When weekly and daily levels coincide, they make a good support/resistance. Always watch for those.
If I believe that the trend is down I will enter on any level, after a retracement towards the opposite side but price must show a hesitation on a level before you enter.
On the long side if price bounces of D1Sup0, I can target 78, if bounces from 23 I can target D1Res0.
I always expect a symmetry in prices for the day. If the low of the day is D1Sup0 for example, I only expect the price maximum towards 61.8 on fibo..
So always target the symmetry of the lowest of the day or highest of the day..
It is all probabilities. Just make sure that there is enough time left until the day and so that you target has a chance to hit.
Hope this helps..
spx hit daily support 4, or 99% volatility range, a huge skew to downside volatility extreme. Market seem like to do extremely run. "Skew" is a killer for math theory and runners.
Dow hit 50% level, then, drop. spx hit 38% level, then, drop.
I got a "feeling" that calculation of weekly resistance/support may got error?
Fx often overshot on volatility, due to fx is running on spike, overshot to clear out stop loss for them to make $.
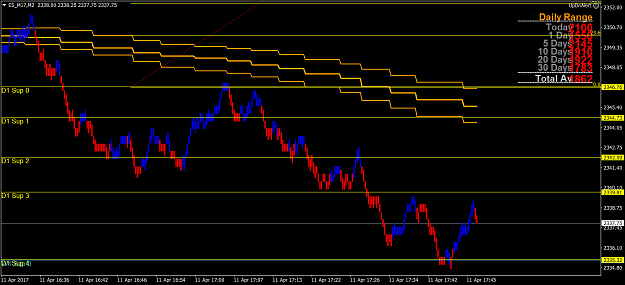
spx hit daily support 4, or 99% volatility range, a huge skew to downside volatility extreme. Market seem like to do extremely run. "Skew" is a killer for math theory and runners. Dow hit 50% level, then, drop. spx hit 38% level, then, drop. I got a "feeling" that calculation of weekly resistance/support may got error? Fx often overshot on volatility, due to fx is running on spike, overshot to clear out stop loss for them to make $. {image}
Ignored
Hi Jack,
There is no error in weekly levels.
Attached Image (click to enlarge)
As you said spx hit the %99 level on the daily range but touched only the first level of the week, which is normal in huge spikes. But if you see the %99 level hold nicely and than shot up D1Sup0, now it seems like it might come down. Hitting the weekly first level on tuesday means the index was oversold pretty much. Let's see what happens next...
As for the "skew" you mention, I don't think this is a skew at all. It is still running in normal distribution bounds. If it would go way below the %99 level than it could have been called a skew. But not this..
Good Luck..
PS: By the way you have some good long entries.. Congrats...
{quote} Sure metta, Since I only trade sp500 for a long time now, here is pic of my chart. Range bars are 0.50 in height. {image} Red and blue bars come from 3 line break indicator and the 3 orange lines are mtf ma, set at 5 minute timeframe and they are ema37 of close, high and low. And this is it. I don't believe in crowded charts. So this gives me what I want.. Good Luck...
Ignored
hmm very interesting way of trading. Thanks again, i will follow along .
Thanks again for your trading strategy. I am so surprised actually.....
Do you think it's reasonable to use weekly support/resistance line with Fibb for H4 time frame? Thank you.
Here is a brief explanation of how the levels are calculated: Using the absolute value of close differences of past 5 minute bars we find the volatility. We know from statistical rules that Sqrt(time) * volatility = standard deviation Since we have 288 of 5 minute bars per day, we calculate the statistical boundaries of the day (the levels). Sqrt(288) * Volatility * 1.00 Sqrt(288) * Volatility * 1.645 Sqrt(288) * Volatility * 1.96 Sqrt(288) * Volatility * 2.576 We add and subtract these calculated values from the daily open.. The last multipliers...
Ignored
Hi Gold,
could you tell me what's the next two ZScores after 2.576?
Hi GoldTheHun, Thanks again for your trading strategy. I am so surprised actually..... Do you think it's reasonable to use weekly support/resistance line with Fibb for H4 time frame? Thank you.
Ignored
Hi JKLee,
Since these levels are time independent you can use them for any time frame you like as long as you make sure that the calculation chart is 5 minute time frame..