I would like to share my views on UJ based on the RTM methods learned through FF. I would appreciate any comment. Lets see.
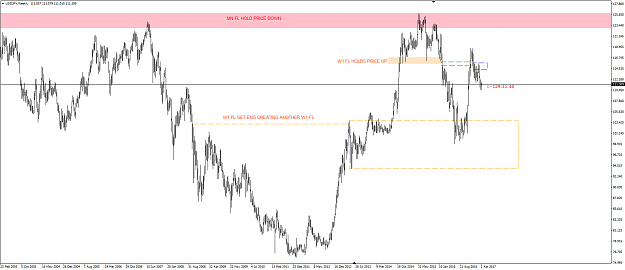
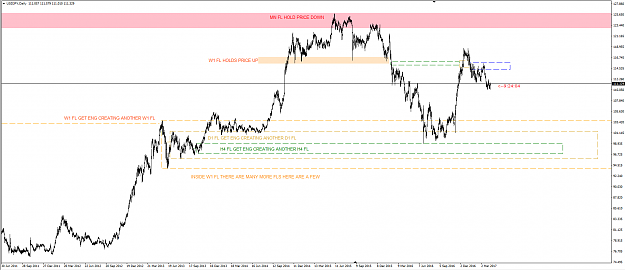
UJ daily:

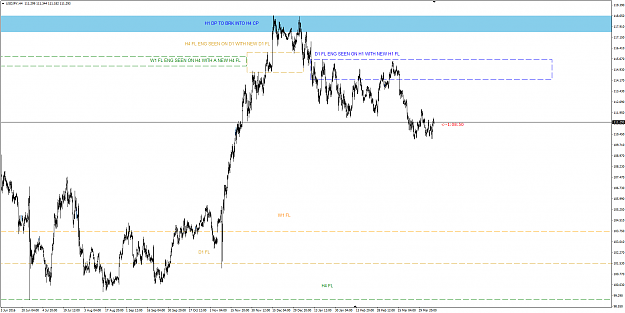
Here we see blue FL engulfed(Important FL if price wants to go down). Price wants the pink target below. It can rally up to the source of the engulf, which is the stacked supply / QM levels. Maybe even FO to the FTR origin of the move down(which is not shown in the picture, because I don't think it will reach there). That would be dream PA.
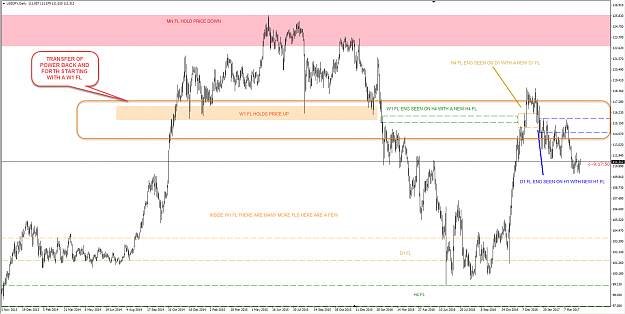
UJ 1h:

Blue line is the important FL that is engulfed. Red rectangle is the possible FL after the break of the blue FL. It is not yet defined as price may retrace up, thus making it an engulf only. If that red rectangle breaks upwards, no trades till the supply/QM levels at the daily chart. (Even than expecting a possible FO to origin). I marked the red rectangle because price may not break this red rectangle, instead consolidate and move down. Will have to watch PA.
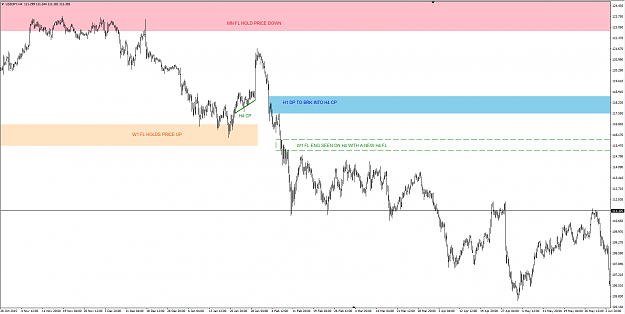
UJ 15min:

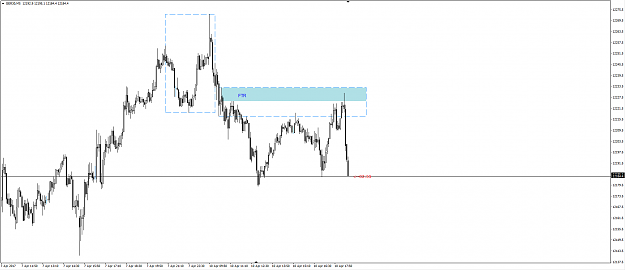
We see the intent of the price to go down with the engulf down marked. It is not a fakeout, as there were no better orders left for it to FO to. It was a signal. That is the reason I drew the big red rectangle that formed after breaking the blue FL early. This shows that bears are strong and price may not deeply retrace to the origin of the move(QM/Supply Levels at the daily chart), make a small retracement up to the 15 min flag and go down.
That would make the big red rectangle a valid FL
Please comment and share your ideas.
(First time posting charts here, excuse any mistakes.)
UJ daily:
Attached Image (click to enlarge)
Here we see blue FL engulfed(Important FL if price wants to go down). Price wants the pink target below. It can rally up to the source of the engulf, which is the stacked supply / QM levels. Maybe even FO to the FTR origin of the move down(which is not shown in the picture, because I don't think it will reach there). That would be dream PA.
UJ 1h:
Attached Image (click to enlarge)
Blue line is the important FL that is engulfed. Red rectangle is the possible FL after the break of the blue FL. It is not yet defined as price may retrace up, thus making it an engulf only. If that red rectangle breaks upwards, no trades till the supply/QM levels at the daily chart. (Even than expecting a possible FO to origin). I marked the red rectangle because price may not break this red rectangle, instead consolidate and move down. Will have to watch PA.
UJ 15min:
Attached Image (click to enlarge)
We see the intent of the price to go down with the engulf down marked. It is not a fakeout, as there were no better orders left for it to FO to. It was a signal. That is the reason I drew the big red rectangle that formed after breaking the blue FL early. This shows that bears are strong and price may not deeply retrace to the origin of the move(QM/Supply Levels at the daily chart), make a small retracement up to the 15 min flag and go down.
That would make the big red rectangle a valid FL
Please comment and share your ideas.
(First time posting charts here, excuse any mistakes.)