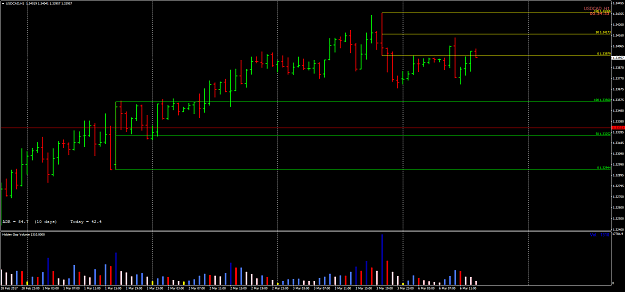
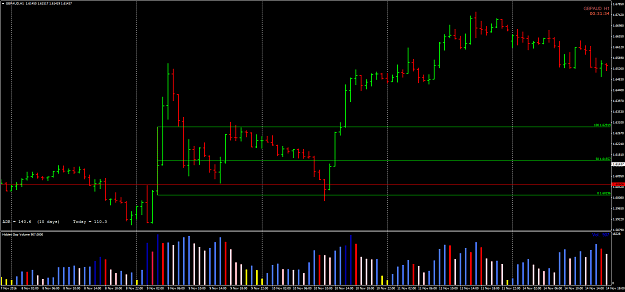
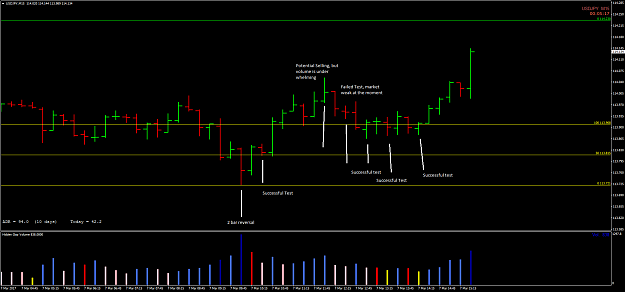
Disliked{quote} VZA lays out the playing field. If you take the ADR and add it to the 50% level of YVZ you get 1.3452, mark off that 1.3452 and scroll back on H1 and look for HV zones around that level, which is the H1 from Nov. 11, 2016. Now we have our playing field. The yellow line is YVZ, the white line is TVZ and the green line is the H1 from Nov. 11, 2016. Do you see how USDCAD didn't have much room to go up from those 2 bar reversals? When you're looking for trades the first thing that should cross your mind is how much can you get out of your trade?...Ignored
I got a question - when we calculate potentail R:R - we have to count nearest lvl of potentional taking profit zone? Or we can aim to 50% for example?