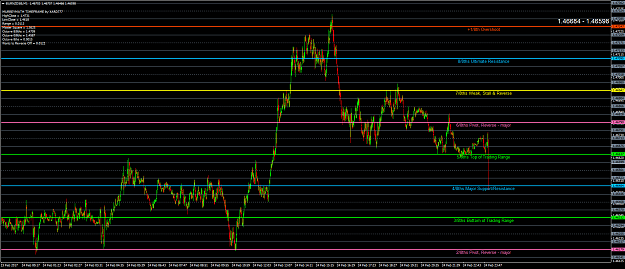
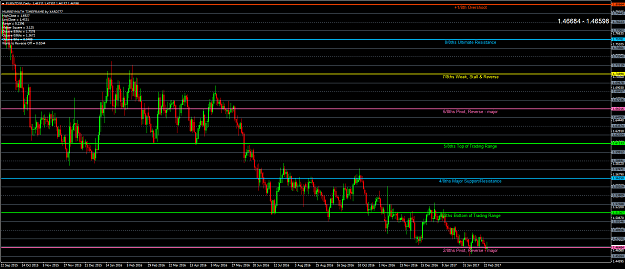
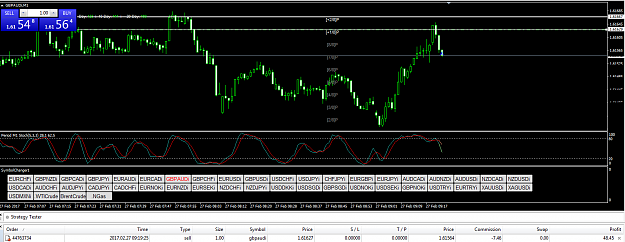
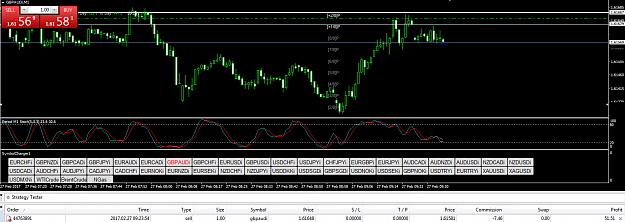
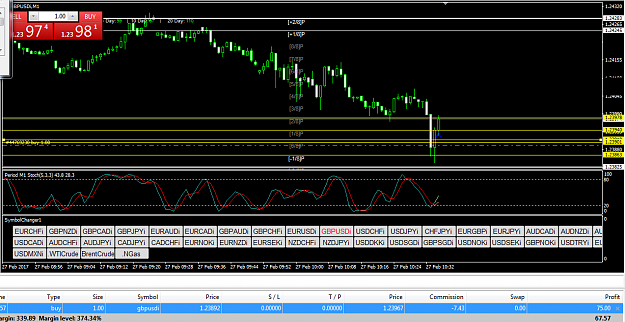
DislikedJust to keep the thread ticking over, 2 charts from today, to be honest not sure what the quantum side of the thread is about {image} {image}Ignored
This statement comes from most of the sites I have visited regarding Murray Math Lines:
"Now, if price moves beyond the +1/8 or -1/8 lines, then 95% of the time it will reverse when it hits +2/8 or -2/8. Remember, the market was already in overbought (8/8) or
oversold (0/8) mode, so once we push that to the extreme (+2/8 or -2/8) it is extremely unlikely (95% chance) to reverse."
This makes some sense because whenever I trade off the 2/8 lines stochastics show that price has been overbought/oversold for a while. I would like to know the calculations that go into each line however. Do they factor in time versus price movement and thus assign a level of extreme support and resistance? Or is it really as simple as the video says where the market always pulls back in 1/8ths? That seems a little ridiculous to me.
1