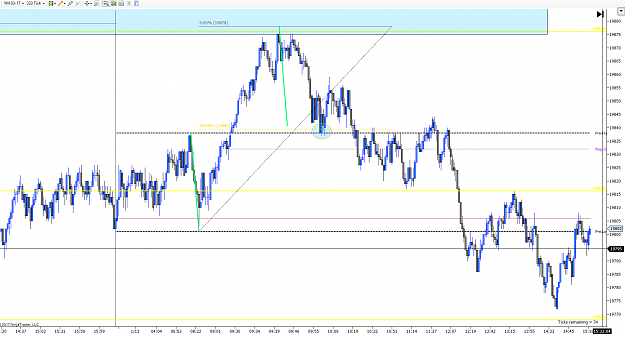
DislikedQuestion for you guys on YM, last Friday. I took one of Mack2013's charts and showed where i would have tried to go long (see 3 blue arrows) at that time given price structure. Basically, i had identified the white zone acting as my line in the sand, i.e., above this zone i was bullish, below i would have turned bearish. Exception to this would have been a near double top where i would have changed my mind and probably go short at this double top with first target at the white zone (line in the sand). Do you see something faulty in my analysis?...Ignored
Attached Image (click to enlarge)
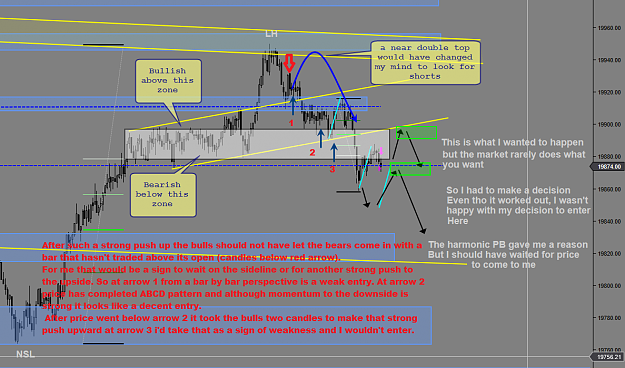
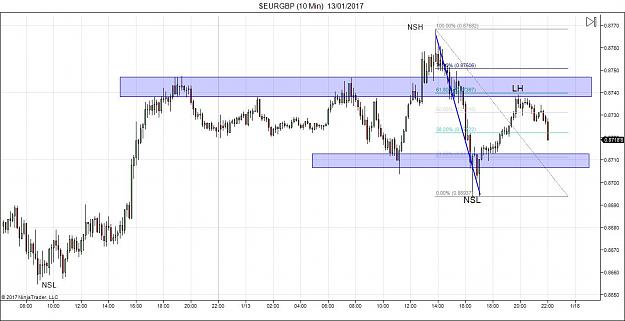
One last thing... when price makes a very strong move, in this case to the upside and afterwards doesn't retrace to the 38.2 fib and attempt to create a NSH but starts making a pullback with NSLs and LHs on the immediate orderflow (aka AB=CD or three drive) I tend to see this as a major weakness and in our case I would favour a short although the expectation is a NSH.
Edit: In hindsight this is easy to see... but during a session it's a very different thing
1