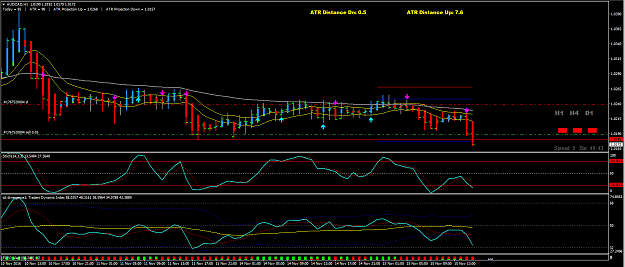
Dislikedgreeting mr moonie i think there is something wrong with mehdi343 indicator- i get alert for some set ups that aren't comply with rules at all (for example - audusd pair - i checked the 1h and 4h and also daily chart but none of them comply with our ruels) could you explain little bit more about this indicator for example: if i were to open 4h chart does this indicator show all the set ups for 4h + setup for 1h chart and daily chart in current window ? i only take cross and bounce above or under the yellow line does this indicator also follows this...Ignored
Please can you confirm that the alert you received started with "Mehdi". I think my template has alerts set to true on the TDI indicators, you can turn these off to avoid confusion.
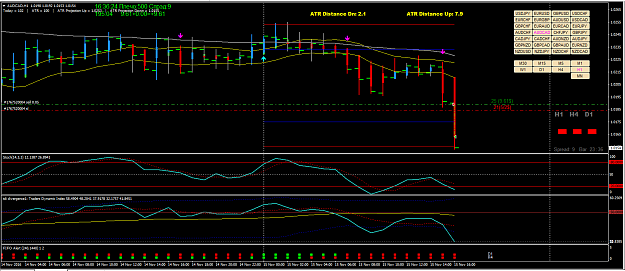
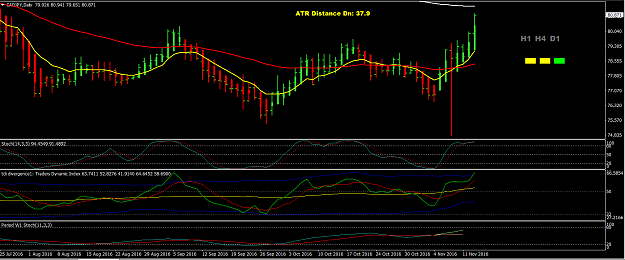
I've had a look through some of my images and have picked some to demonstrate my perfect setup. If you go to post 4834 and open the two images there.
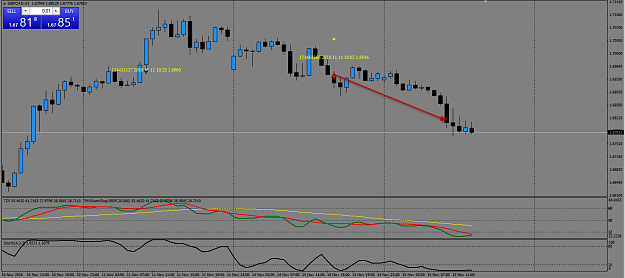
H4
- Price has closed below the yellow synergy lines
- green has crossed below red, both below the yellow market baseline.
- Stochastic is bobbling along the bottom
- FIFO and Multimeter are all red
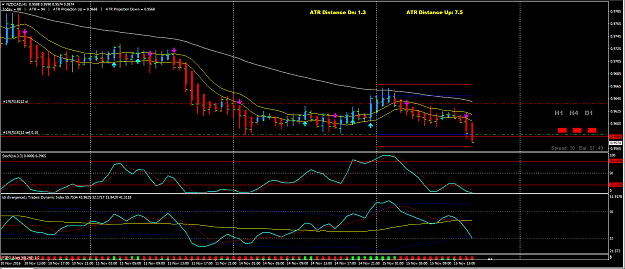
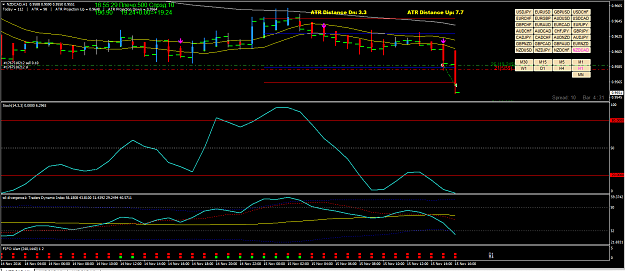
D1
- Price has closed below the yellow synergy lines
- Green is heading down and has crossed the yellow market baseline.
- Red has turned and is heading down
- Price previously bounced off the 200 ema around the 10th October, so may head there again
- Multimeter confirms but FIFO doesn't. I ignore because FIFO confirmed on the H4 chart.
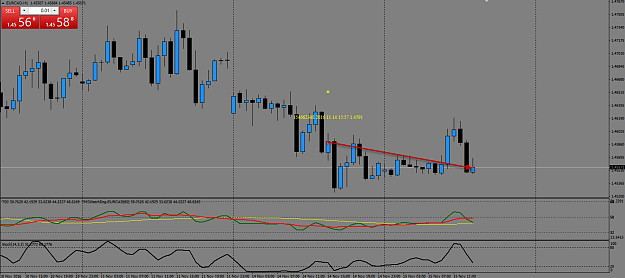
If there is a H1 setup the same as the H4 above, I will be all over it like a rash.
This is basically how I look at the three time frames. D1 isn't perfect, but there is enough there to make it look like it is going short.
Hope that helps.
Cheers
Moonie.
2