DislikedThree to Swing: Waves, Support & Resistance Levels, S&R Zones, and Trendlines (Continuation)Ignored
Bar 4: The Invisible Line and Points of Control.
The 5 macro notions in price analysis (Swings, Waves, Support & Resistance Levels, S&R Zones, and Trendlines) were defined in the previous post. All the following notions are built upon those principles and they will only add depth in the analysis. They shouldnt be interpreted (used) outside of this context.
Adding a 4th Bar in the original example will clarify the notion of mini points of control that I mentioned before. It will also give a very powerful visual aid to recognize what is the market doing right now and ,particularly important, will give us the first hint to develop a price based trigger. But before that lets define in more detail what points of control are.
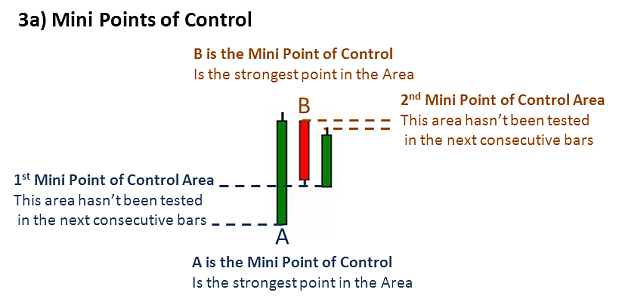
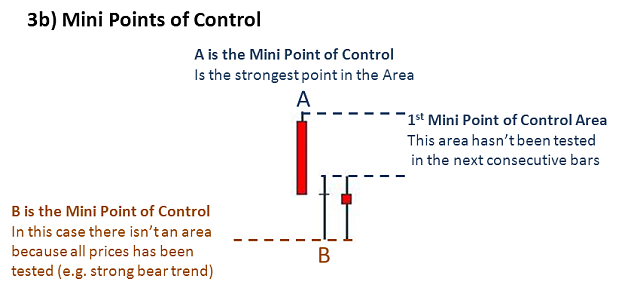
Points of control can be defined as any price or price range that hasnt been tested in the next consecutive bars. They can be the ultimate top or bottom in a chart (strongest points of control), a Support or Resistance Levels in a swing (normal points of control) or more commonly, areas between consecutive bars in a wave (mini points of control).
With just an ex-post chart (after the fact) and with only few bars we dont know why this happened (e.g. Point A in Fig. 3a. because of lack of selling interest or strong buying at those levels or the opposite on Point A in Fig. 3b.) but in general:
- As long as price is trading above/below these levels bulls/bears will be in control.
- The wider the mini area of control the strongest the trend but also the deeper the potential pullback/retracement. As you can clearly see the mini points of control A in both Figures are a lot wider than the mini points of control B sending a clear message to who is in control (bulls in fig. 3a. and bears in fig 3b.)
The Invisible Line
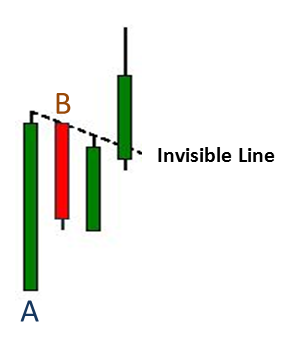
Going back to the original example (Fig 4a)
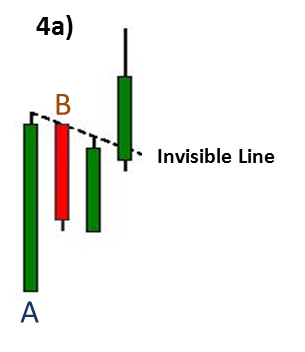
- We knew that there were stronger (smarter/early) buyers at the open of the 1st bar and there is a wall protecting them. After the close of the 3rd bar, sellers couldnt break the bulls in every single price on the 1st bar range to take control, making the open/low of the 1st bar a mini point of control (Point A).
- We also knew that although sellers were dominating in the 2nd bar, there were almost wiped-out by the buyers on the 3rd bar leaving only a few sellers still holding in profits and making the open/high of the second bar the second mini point of control (Point B). The 4th bar confirmed the bears failure to take over the bulls stoking the move up when they covered their positions and attracting new breakout buyers.
- Finally, we knew after the 2nd bar that we had a clear setup for potential longs and the closer to the 1st point of control (Point A) you go long the smaller the stops and the higher the potential targets for profits but because the move was not confirmed until a break of the 2nd point of control (Point B) there was also greater chances that price can fail to continue moving up. Here is where the invisible line comes to play.
If you connect with an invisible line (the dotted line in the chart) the Highs/Lows (depending on the case) of consecutive bars you can establish a visual aid of where and when a particular point of control is going to be broken. In the case of fig 4a) you can plot that line joining the highs of the 1st, 2nd (Point B!!!!) and 3rd bar and you can clearly recognize how after a few ticks in the 4th bar that line was broken (and not coming back!!!) and the move up was confirmed.
Obviously if you didnt pull the trigger on time the invisible line will tell you YOU ARE TOO LATE, YOU MISSED THE TRAIN, COME BACK LATER
The second very important piece of information with an invisible line is given by its SLOPE. The slope of this invisible line will most of time tell you if you are in the wrong side of the market in the current wave, the strength of a trend and pullbacks and if the move is overextended (overbought in an uptrend) without indicators !!!! (e.g. in an uptrend the invisible line instead of sloping down or horizontal has a steep slope up). These cases will be clearer when more bars are introduced in the analysis.
The same analysis goes for Fig 4b).
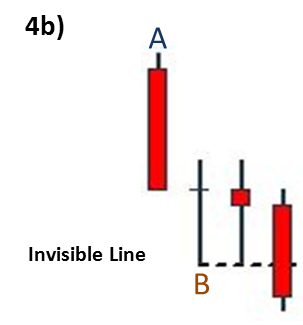
- We knew that stronger (smarter, early) sellers at the open of the 1st bar had a wall protecting them. After the close of the 3rd bar, sellers couldnt break the bulls in every single price on the 1st bar range to take control, making the open/high of the 1st bar a mini point of control (Point A) and leaving a very wide mini point of control area untested.
- In the 2nd bar the move down was confirmed. However, by the close of the 2nd bar, we also knew that buyers overwhelm the sellers at the lows closing the bar at the break point (low/close of the 1st bar) leaving the sellers on the break of the 1st bar that didnt take profits uncovered (especially weaker hands may have started covering shorts if price would have moved above the high of the 2nd bar). But this didnt happen and by the close of the 3rd bar all prices of the 2nd bar range were tested making the open/low of the second bar the second mini point of control (Point B).
- Finally, we knew after the 3rd bar that bears were in full control and it was too late to get in the train. Nevertheless, if we introduce the invisible line joining the consecutive lows of the 2nd, (Point B!!!!) and 3rd bar, we can clearly recognize that after holding for a while, the bulls gave up and the line was broken and the move down was confirmed.
Remember that the slope of this invisible line will most of time tell you if you are in the wrong side of the market in the current wave, the strength of a trend and pullbacks and if the move is overextended (oversold in a downtrend) without indicators !!!! (e.g. in an downtrend the invisible line instead of sloping up or horizontal has a steep slope down).
Therefore, pay particular attention in this case to the slope of this line (horizontal in a downtrend) in comparison with the previous case (sloping down in an uptrend) and try to find what the market is telling you. (Hint: Starting move, continuation move or potential reversal)
Some very important notes on Invisible Lines:
- Always respect the order in the analysis (3 Essential notions in price analysis). These lines are only worth if you already have defined the current direction (e.g. wave analysis HH, HL, etc) and you are in the right side of the market.
- So NEVER EVER go against the current direction. If you go crazy plotting invisible lines connecting every single consecutive High or Low you are going to have a very poor profit/loss ratio and your broker will end up making more money than you (if you make any). Remember this is a visual aid to recognize what is the market doing right now, and a first useful hint to develop a price based trigger.
- In other words, you only draw these lines on the side that is controlling the current move. In case 4a) we only draw a line on the highs because bulls are in control and in 4b) on the lows because bears were in control.
- Always check if the instrument and timeframe are giving you enough room (true range) to apply this notion. If you are trading very fast charts or tiny range instruments, your analysis can be right but it may be impossible to implement in practice.
The final use of these lines are to add a fast, objective and efficient tool to evaluate any chart without getting lost in translation with indicators.
Try it. Open any chart, find the last 2 or 3 swings, define what are they signaling (HH, HL, LL, LH), check the last bars on the current wave and plot the invisible line connecting the highs or lows (depending on the direction you see in the swings). If you can't establish [in the first minutes you see the chart] the current direction and where in the current wave the market is, just close everything and come back later, the market is in choppy mode....
TBC....
sisse