|
Commercial Member
|
Joined Aug 2016
|4,132 Posts
yes its awesome I unlocked at 104 70 holding shorts on Stops. As we said volatility lots on the TA. EUR reached its short target to , These are the types of markets I like to trade range expansion with solid resistance at the pivots.
As a trader , ch artist you have to be a scalper in order to effectually, hedge release add on take of . Production max size min risk...now the Sqz
I'm curious about one thing... Your advice to use overnight range as base for our day analysis.
Have you a valid reason for that ? If so, can you explain ?
I'm doing some research motivated by the ACD system from Mark Fisher and found something curious that validates the reason to use that range (only for forex).
It's time consuming, not ready yet, but when i have something useful i will post.
{quote} Ah yes we reached. Not much response from market but we have edged up a bit. Targets 1 0920 1 0980 1.1000 should be a pullback aTo: ayoayo | From: Dennis1468 | Sent: Oct 23, 2016 12:26pm --------------------------------------------------------------------------------- leave stops in place now buy at 1.0850 and that buy order leave stop at 1 0810t 1.100 to 1 0960 enter again on the pull back from 1.1000
Ignored
Quoting Dennis1468
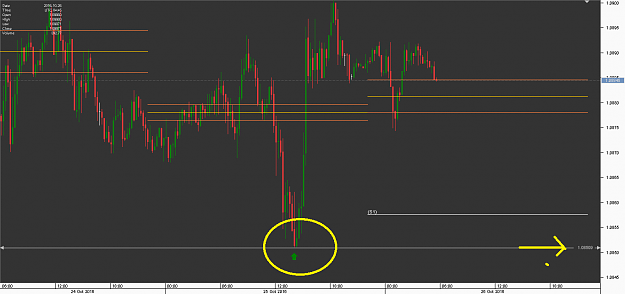
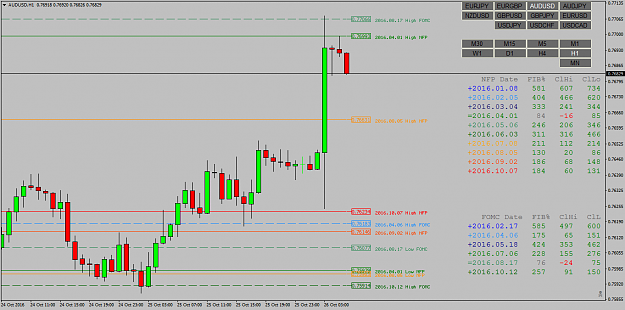
EUR USD For those who have IM me on EU Questions, I can only IM once every 24 hours as Commercial Member so below Chart is for you: The Horizontal lines on below 4 H EU chart is your Key areas of potential rejection or Failure. We see now we are at the key Area marked in yellow/current price for potential up swing if Bulls can defend. If they cant defend then the bears get paid all the way down to the Green line for fight on there {image}
Hi Dennis,
Can we consider the level as having been defended yet. If yes what are the possible upside target?
And again under what condition will you consider a level either defended or having been violated?
Thanks and regards.
That was a call from awaiting spider about a week to buy EU at 1.0850................
Hi Dennis I'm curious about one thing... Your advice to use overnight range as base for our day analysis. Have you a valid reason for that ? If so, can you explain ? I'm doing some research motivated by the ACD system from Mark Fisher and found something curious that validates the reason to use that range (only for forex). It's time consuming, not ready yet, but when i have something useful i will post. JL
Ignored
Hi jlongo,
I dont know if my reason is valid. but I use it as I see the Range as a High and Low. So for me that range is opportunity as a break out trade or a fade move. That range once broken normally stays firm for the remainder and to the next session. I am not sure if its valid as I have no statistical data. It would be interesting to see your result studies once completed.
|
Commercial Member
|
Joined Aug 2016
|4,132 Posts
Now within the intra-day Charts within the pivots,ADR,CPR/IB/OB we can trade inside the lines of defense. As market spends a lot of time coiling up and if we only trade optimum value at the Defensive positions we will be limited to Position Trader Value Areas.
Going Backwards you need to know all the types of professional traders and then to be one of those types you need to know them all. So you can switch from position trading to day trading at the time you feel its most profitable.
|
Commercial Member
|
Joined Aug 2016
|4,132 Posts
Here is a Mad Tip if you have grasped everything in this Thread
Invest in a Good Printer. Print out the Daily and the monthly on your main 2 pairs. Plot the entry levels. On Monday Enter your market orders. Thats all that is required for position traders.
{quote} Quoting Dennis1468 EUR USD For those who have IM me on EU Questions, I can only IM once every 24 hours as Commercial Member so below Chart is for you: The Horizontal lines on below 4 H EU chart is your Key areas of potential rejection or Failure. We see now we are at the key Area marked in yellow/current price for potential up swing if Bulls can defend. If they cant defend then the bears get paid all the way down to the Green line for fight on there {image} Hi...
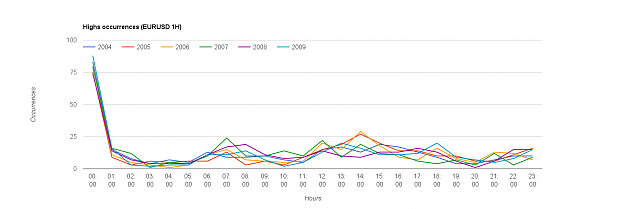
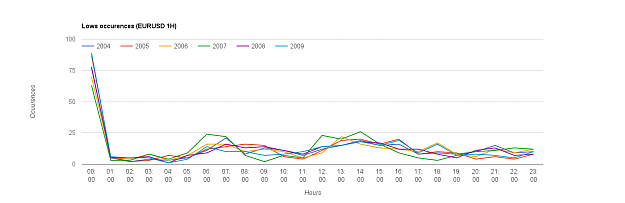
I have read the book "The logical trader" from Mark Fisher and on this book on ACD system, he says that the open range (that can be from 5m to 1h) depending on asset in consideration represent 20% of the highs or lows for the day. As he trades mostly commodities and stocks that have different beavior on forex, i want to find on what way and how i can find something similar in it (forex). In this case i used the period of one hour and check on every day of any year from 2004 onwards at what hour occurred the high and low of the day. Each hour placed on chart relates the period started by its label time till label:59:59:999. One problem i found are some unexpected greater values between 21h and 23h... The reason for this is the historical data i have is based on GMT and sundays highs/lows are affecting the values. I made a change to integrate the values of sunday on monday. The resulting charts are the results found (GMT time based).
Well, you can take your conclusions about the data presented and take that information forward.
I will make similar studies for the majors and timeframes 5m, 10m, 15m, 30m and 1h (actual for EURUSD).
Hi all I have read the book "The logical trader" from Mark Fisher and on this book on ACD system, he says that the open range (that can be from 5m to 1h) depending on asset in consideration represent 20% of the highs or lows for the day. As he trades mostly commodities and stocks that have different beavior on forex, i want to find on what way and how i can find something similar in it (forex). In this case i used the period of one hour and check on every day of any year from 2004 onwards at what hour occurred...
{quote} Pretty simple actually. Price is either going up or down. Many days it goes one way from the start. That accounts for the data skewing to 00:00.
Ignored
Yes, but at first sight, you expect the highs and lows to be at where we have more players (london/ny sessions)...
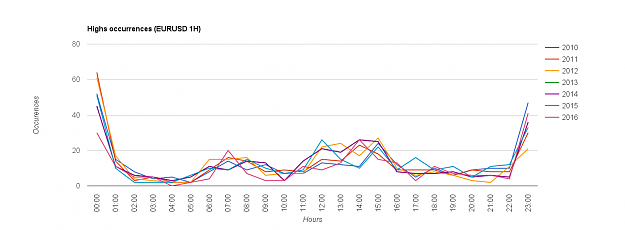
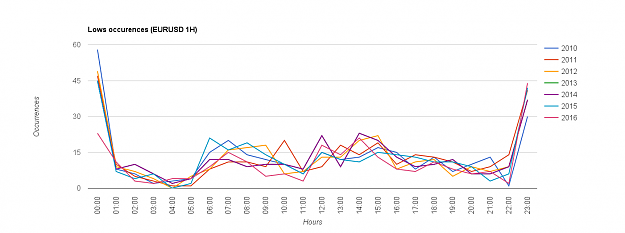
Other thing that suprises me is the move up at the end of day in highs and lows beginning in 2010 (i checked twice as the difference is significant) and the lowering of highs and lows at the start of the day. Also London open and the midle of day get in general greater values after 2010.
Need to check other instruments to see if the patern persist.