|
Commercial Member
|
Joined Aug 2016
|4,132 Posts
ADR - info
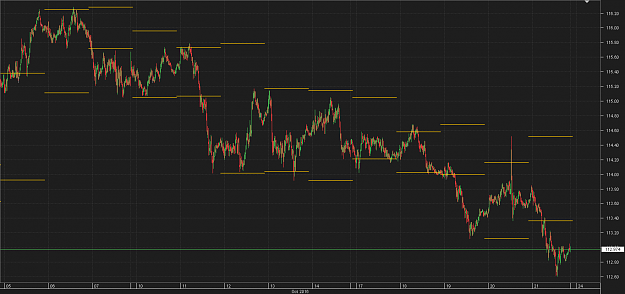
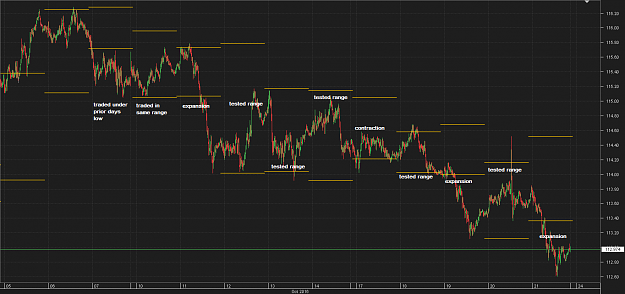
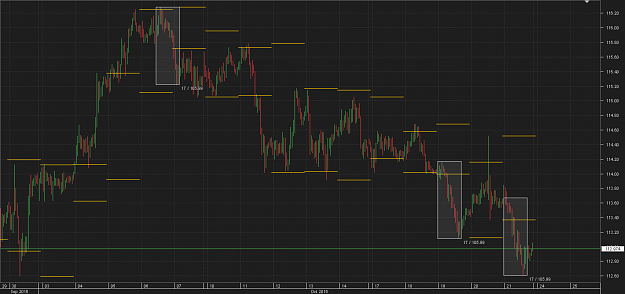
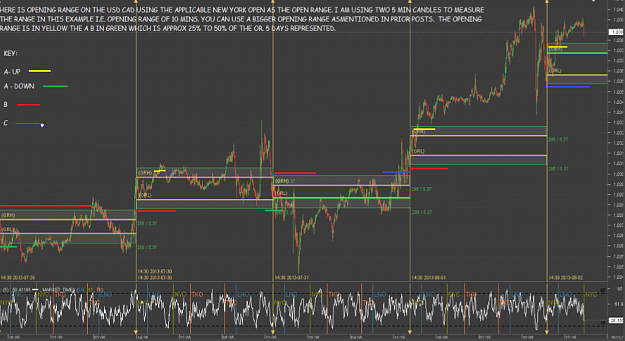
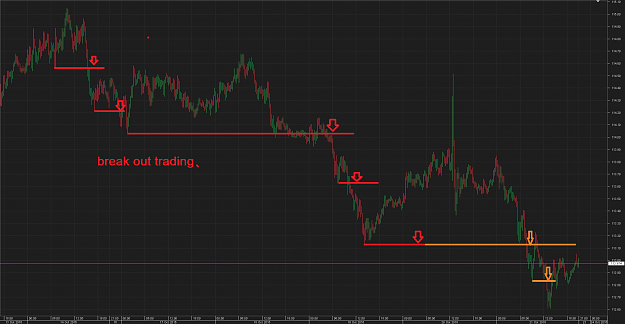
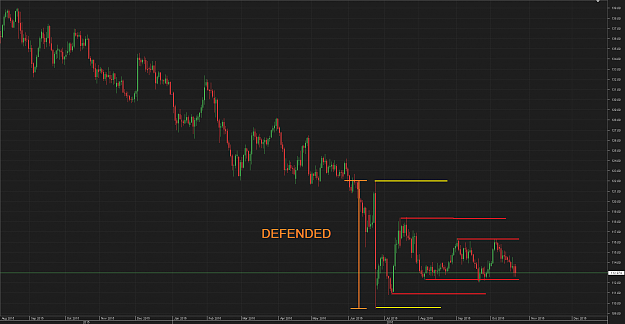
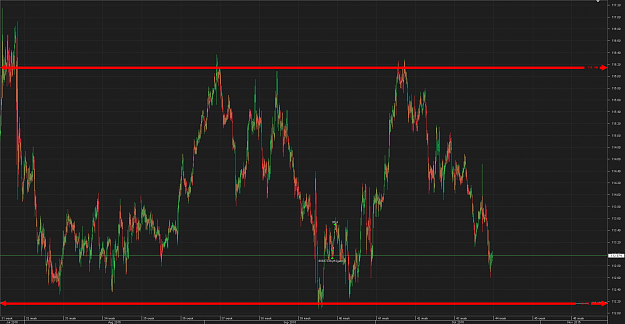
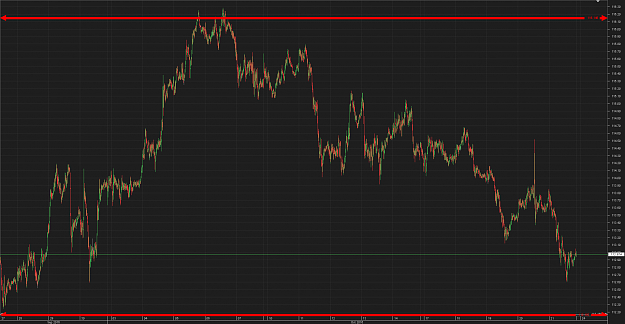
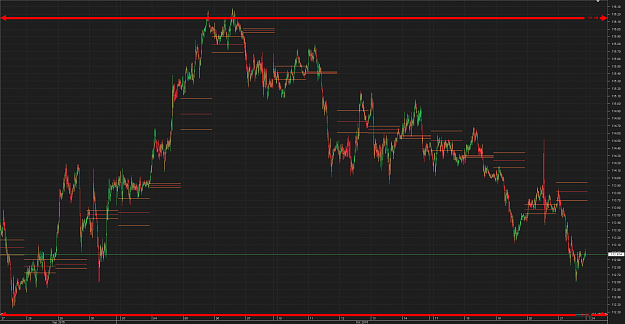
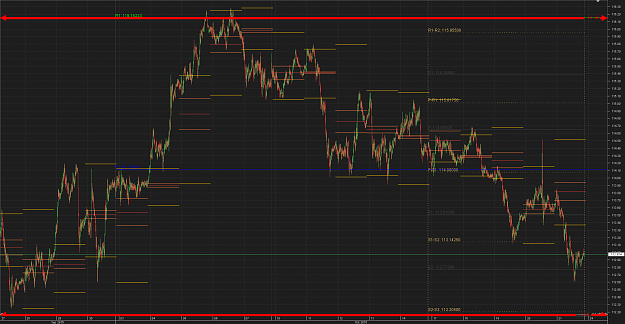
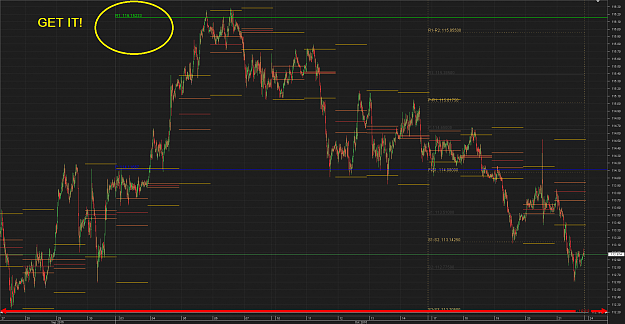
1 The first thing I want everyone to take note of is that the yellow lines are the high and low of the previous days ADR within the below chart
2 The Lower Chart Shows When price is not agreed at the low or high of ADR and price Auctions to value
3 On the 3rd Chart the Expansion is always near equal to 105 Pips , last chart shows to expansions in box on right and the one box on left shows the initial Finger print from the end of a medium up move that contracted.
Hi all... Maybe this worth a reading as it is related with PivotBoss origins. A resume of Mark Fisher methodology. JL {file}
Ignored
Yes it does exactly, Thats Mark B. Fisher formally at CMG now CEO MBF
As we cover ADR will cover My own Spin how I use it and will also cover Marks brilliant work on ACD. However I prefer TC BC/Gap and fade entries over Marks however I like his ADR rolling relationships but prefer Franks spin on that.
Trading is like science, all the facts from various streams build the Theory
ADR - info 1 The first thing I want everyone to take note of is that the yellow lines are the high and low of the previous days ADR within the below chart 2 The Lower Chart Shows When price is not agreed at the low or high of ADR and price Auctions to value 3 On the 3rd Chart the Expansion is always near equal to 105 Pips , last chart shows to expansions in box on right and the one box on left shows the initial Finger print from the end of a medium up move that contracted. {image} {image} {image}
Ignored
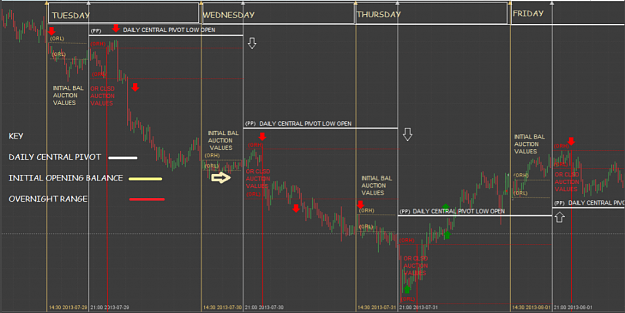
Now with ADR and IB Initial Balance in mind Lets take a closer look at Mark B Fischer's Work.
1. This is very complementary to the Concepts we have already covered in this thread:
Knowing your ACD: Entry techniques
ACD is a disciplined approach to controlling risk and preserving capital. Imagine that the initial Balance is the Fulcrum in which the entire ACD trading system sits and without it the entire system will come crashing down. The basics of ACD is to plot defined price points in relation to the opening range.
Point A: Up or down are based upon a certain number of pips above or below the opening range and if trading is sustained at these levels for a period of time equivalents to hald the duration of the opening that you have chosen. On any day you can have an A up or A down. The A points are determined if price trades above or below the opening range, There is only one A that means once an A up is achieved there can be no A down for the day or if an A down is established first there can be no A up for the day.
As you plot Various Price reference points you must ask yourself where you would get out if you were wrong So your exit point if the trade goes against you we will call it the B level.
So once you have established a A up or A down! Your stop for getting out of a unprofitable trade is the B Level. in which you are Bias Neutral as your outside of the opening range.
|
Commercial Member
|
Joined Aug 2016
|4,132 Posts
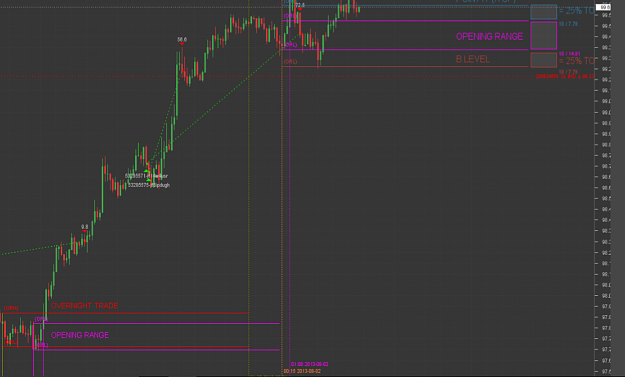
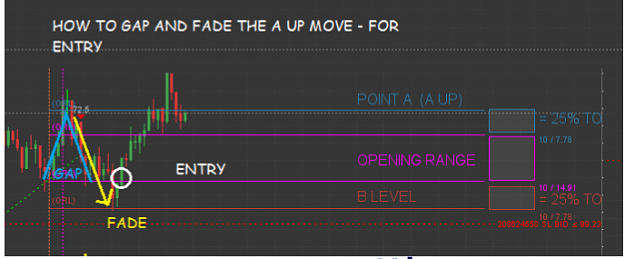
Knowing your ACD Entry Techniques The Gap & Fade Entry Method
We have already covered one entry technique on the above post entering on A up if price holds above initial balance for a certain period of time. Now my favorite method is the Gap & fade move. In this Example Price Gaped up from Opening Range Created an A up (Gap up) then faded back to open range low. Its at that point when price reaches back to the open range low I enter long and put stop at B.
|
Commercial Member
|
Joined Aug 2016
|4,132 Posts
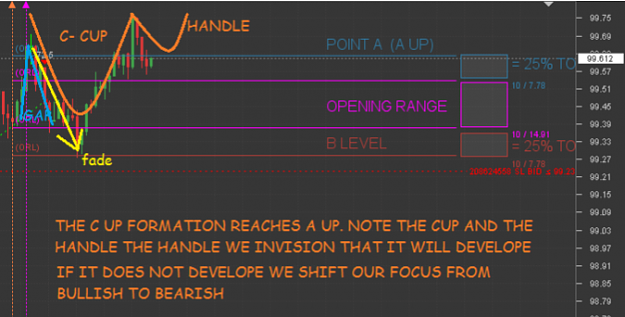
The Advancing C-Cup Entry techniques
The C - Cup is a common pattern in times of low volatility. In the chart below you in vision the handle will form on the C - Cup and it is during the handle formation (Time and Price) you may shift your focus from bullish to bearish if the handle does not brake up from the high at 99.75
|
Commercial Member
|
Joined Aug 2016
|4,132 Posts
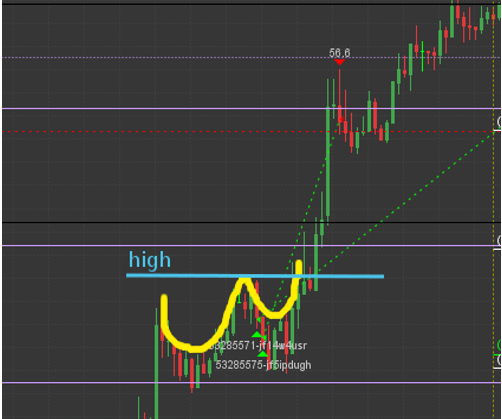
The Advancing C-Cup Entry techniques
A fully developed C-Cup pattern, as handle advances above the high of the c cup. You can see how w nailed this trade for 57 pips first take half profit and you see the tracking line continued.
|
Commercial Member
|
Joined Aug 2016
|4,132 Posts
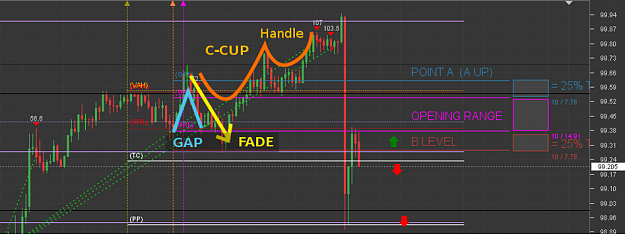
The Failed C-Cup Entry techniques
Here's the outcome of the trade final C-Cup failed however we got over 250 pips from the move from initial entry:
Failed development of handle from initial LONG turns bearish. When a position started from fade, you will have plenty of time to liquidate the trade before it goes against your favor.
|
Commercial Member
|
Joined Aug 2016
|4,132 Posts
Summary ACD
Plotting particular price points in relation to the opening range. It shows reference points against which to trade the "A" and "C" points for entry and the "B" and "D" points as stops. The ACD method calculates the prices above which you'd want to be long and the prices below which you'd want to be short.
ACD Rules The following are five ACD rules:
● Plot point A’s and C’s as points of reference.
● Lean against these reference points as you execute your trades.
● Maximize your size when the trading scenario is favorable. At all times, minimize your risk.
● Know where you are getting out if you’re wrong.
|
Commercial Member
|
Joined Aug 2016
|4,132 Posts
Knowing your ACD Entry Techniques Method Summary - Thanks to Mark B Fischer
A-Down A price level set at a specific number of ticks away from the opening range that is determined by the A values for a particular stock or commodity below the bottom of the opening range. This is an entry level to establish a short bias. A-Up A price level set at a specific number of ticks away from the opening range that is determined by the A values for a particular stock or commodity above the top of the opening range. This is an entry level to establish a long bias. As long as there is sufficient volatility and liquidity in the market, you can use the aggressive nature of ACD trading style to maximize position size while minimizing your risk.
Knowing your ACD Entry Techniques Method Summary
ACD Opening Range (Initial Balance) For the most part, it is a time frame based on an opening of a given market. It is used as an area of reference throughout the day. However, ACD Opening Range is not a static time frame. The trading action dictates when a opening range is to be established for the day. For example, if your normal opening range starts at 9:30am ET, you must adjust it to start at 8:30am ET on the days Unemployment Report comes out. The Opening Range time frame is not static. It should move according to where traders are coming into the market. The Opening Range can be moved to an earlier time like on Unemployment Report days or it can be move to a later time on FOMC Meeting Days where the Opening Range starts at 2:15pm ET. This is when traders comes into the market to establish their positions.
C-Down A price level set at a specific number of ticks away from the opening range for a particular stock or commodity below the bottom of the opening range. This is an entry level to establish a short bias. A C-Down can be made only if the market has previously had a confirmed A-Up. C-Up A price level set at a specific number of ticks away from the opening range for a particular stock or commodity above the opening range. This is an entry level to establish a long bias. A C-Up can be made only if the market has previously had a confirmed A-Down.
Daily pivot range The daily pivot range is calculated based upon the high, low, and close of the previous trading day. The ACD system identifies this price range as the meat of the market from the previous trading day. This is Mark Fisher's way of saying Value Area.
Failed Point A A failed point A set up can occur based on one of the two following scenarios: (1) the market may approach a Point A value and fail to trade at that value, subsequently reversing its direction and trading back into the opening range. Or, (2) the market may approach a Point A value, trade at that value and even potentially through it. However, it does not stay at the Point A value for at least half of the ACD opening range time frame before reversing its direction and trading back into the opening range. Failed A against/within the pivot If the pivot range proves to be strong enough support or good enough resistance to stop the market at or near a Point A value, the result is a failed A against the pivot. For example, a failed A-Up within the pivot range confirms resistance in that area and increases the likelihood of success if a short position is established at that level. Conversely, a failed A-Down within the pivot confirms support at that level and increases the likelihood of success if a long position is established at that level.
Failed C A failed Point C setup can occur based on one of the following scenarios: (1) the market may approach a Point C value and fail to trade at that value, subsequently reversing its direction and trading back into the opening range. Or, (2) the market may approach a point C value, and then trade at that value and even potentially through it. However, it does not stay at the Point C value for at least half of the ACD opening range time frame before reversing its direction and trading back into the opening range. Failed C against the pivot A failed C against the pivot generally occurs under highly volatile market conditions. The market attempts to reverse its bias at Point C, but runs directly into the meat of the market from the previous trading session, otherwise known as the daily pivot range. The market snaps like a rubber band off this area and reverses back towards the opening range, providing the trader with a clear point of reference at the failed C level.
Fear and greed Fear and greed are the two key ingredients that every trader needs to possess in the right combination in order to be successful. A trader must be greedy and willing to press winning trades and maximize market opportunities. Goods news/ bad action A classic trading scenario that allows the trader to combine the ACD system with market psychology. This setup requires an anticipated directional move by the market based on new fundamental developments. However, for reasons that bewilder most traders, the market fails to technically respond to that news in the anticipated direction. Island Reversal Formation An Island Reversal Formation occurs when the market has a fake-out to the upside or the downside, gapping lower the day after previously gapping higher (or vice versa).
Knowing your ACD Entry Techniques Method Summary
Late-day Point C pivot trade This is the Rolls Royce of all ACD system trading scenarios. This setup’s high probability of success, coupled with its very low risk, make it extremely attractive. The trade works best if it occurs late in the day, trapping speculators who feel they must liquidate by the close. Maximize size, minimize risk The concept of maximizing size and minimizing risk is a vital ingredient to any successful trading strategy. The ACD methodology applies this concept in identifying trading scenarios that utilize low-risk reference areas such as the opening range, pivot range, and other ACD areas.
Momentum This macro ACD indicator can be utilized by longer-term traders to help them identify when to exit trades. In the ACD system, momentum is used to clearly show who the winners and losers are in a market over a specific period of time. This ACD tool compares the close of the market today in relation to its close eight days ago to determine whether the shorts or the longs have the upper hand. Number line The main purpose of the number line is to identify a potentially developing trend. That generally occurs when the cumulative sum of the past 30 trading days based on macro ACD goes from a 0 to a +/- 9, a level it must maintain for two consecutive trading days in order to be considered significant. A much simpler approach that I use is counting the number of support and resistance levels. When the market continues to go up, you see the number of support levels increase and the number of previous resistance levels decrease or become non-existent. You can count that as your number line.
Pivot on a gap When the Market gaps open, above or below the daily pivot range, and never trades into the daily pivot range from that day, a pivot on gap day has been established. That pivot on gap day level becomes critical support or resistance for future trading sessions. Point B Point B is the price at which your bias shifts to neutral. Once a Point A (up or down) has been established, your stop is now Point B. The B level is the bottom of the opening range for an A up, or the top of the opening range for an A down. Point D Point D is the price at which your bias shifts to neutral and is your stop after the market has already established a C in one direction. Once Point D has been hit, the trader has been chopped up enough for the day and should walk away from the market for the rest of the trading day. Points of reference
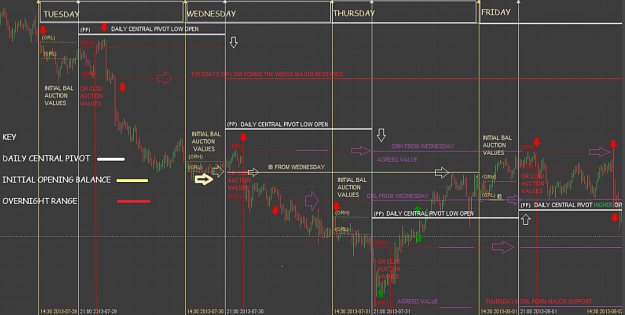
ACD provides traders with reference levels to lean against to minimize their trading risk. Rolling pivot range The rolling pivot range, usually spanning three to six trading days, acts as a reference point for entering and exiting trades. ACD uses the rolling pivot range as a trailing stop for winning positions. It also provides traders a point of reference to quickly exit losing positions. One of its best functions is that it helps prevent a trader from turning winning positions into losing ones. Sentiment divergence This ACD setup relies upon divergences occurring between market price action and human sentiment. This trade tries to catch traders who don’t believe in recent market price behavior and who have faded the recent move. This setup alerts the trader if the market gaps away from these traders and tries to capitalize on the ensuing panic liquidation that inevitably takes place.
Statistically significant The ACD methodology is based upon the premise that the opening range of each day’s trading session is statistically significant. In layman’s terms, this means that the opening range is not like all the other 5- or 10-minute intervals of the trading day. Rather, the opening range is the statistically significant part of the trading day, marking the high or low for the day (in volatile markets) about 20 percent of the time. This concept directly refutes the random walk theory. Time factor In trading, time is actually a much more important variable than price. When determining whether you have made a good A-Up or a good A-Down, it is much more important how much time the market spends at that level than at what price it trades. Unsuccessful traders tend to rely too much on price and not enough on time when entering or exiting the market.
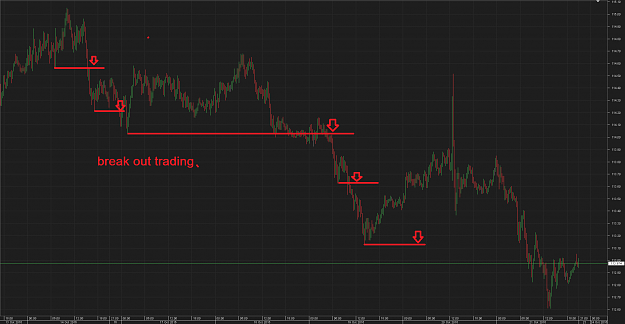
how to plot your daily before you dialing to your 15 bar {image}
Ignored
So summary: your TA starts with top down approach by marking the significant levels form higher time frames. Those levels from the higher time frame I then use A 15 bar to buy at the pre determined levels when fading edges and to perceive longer term targets.