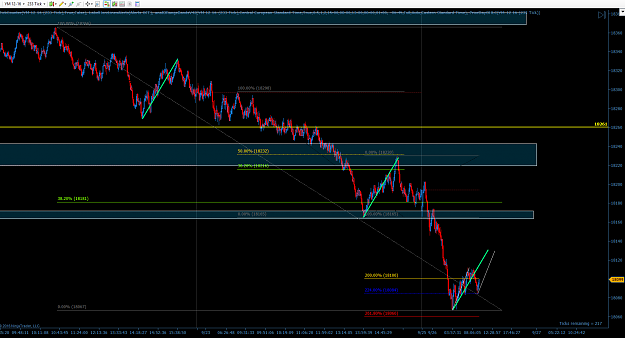
Disliked{quote} The questions are on the chart. I hope I'm understanding this correctly. {image}Ignored
Essentially what you are doing is finding an imbalance in the overnight trade distribution and then looking to take advantage of a fade of these players. Ask yourself who is even trading the overnight session? I have no proof of this, but in my opinion it's weak hands the majority of the time. The amount of instances where the overnight distribution gets faded does not scream "Professional Traders" to me in the slightest. They are retail traders sitting on their positions who hit their "Oh fuck" moment in RTH when they realize the market is no longer going to head in their direction so they're forced to exit.
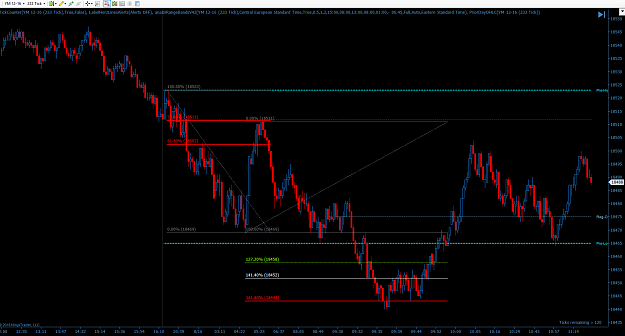
Alright so looking at your chart I'm kind of confused, there might be an issue with your session template. I'm on the East Coast so I have my session template set to "CME US Index Futures ETH2." This sets the chart up so that the close of each day is at 4:15PM (16:15). I think you're on the West Coast so if you're using local time then your session break would be at 1:15PM (13:15). So this means that you'd use any price action from 1:30PM through 6:30am to find your ONH and ONL. Then to find overnight distribution you'd gauge how much of the overnight price action is above or below the prior session close at 4:15 (1:15 for you). There's really no exact science on how to do this, you basically just eyeball it. I think some people use market / volume profile to gauge but this is not necessary imo.
Here's what I see using your chart:
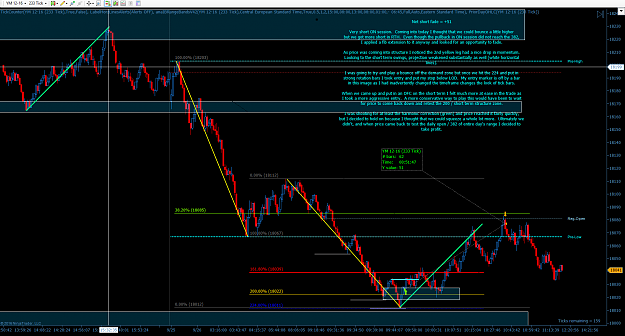
Attached Image (click to enlarge)
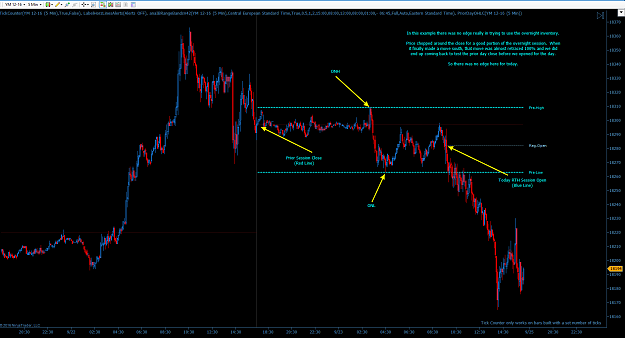
No edge here.
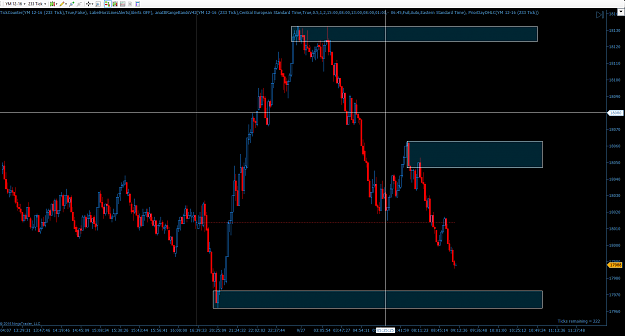
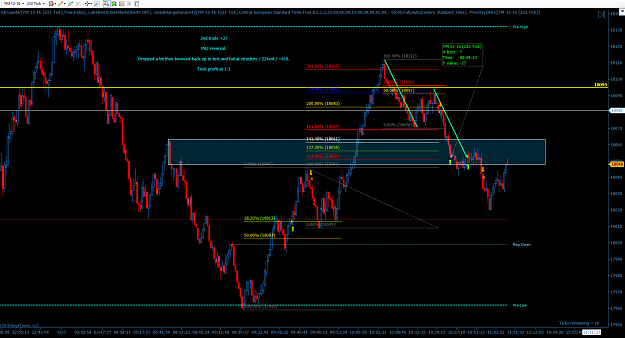
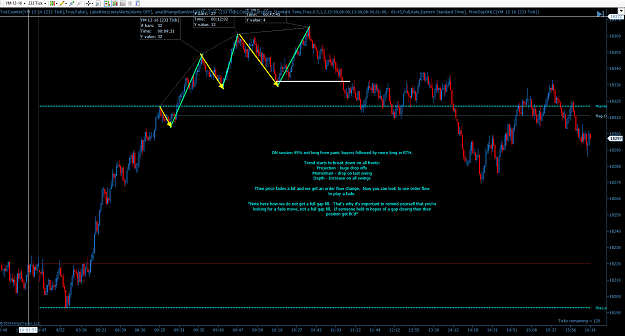
Here are some further examples with notes:
Attached Image (click to enlarge)
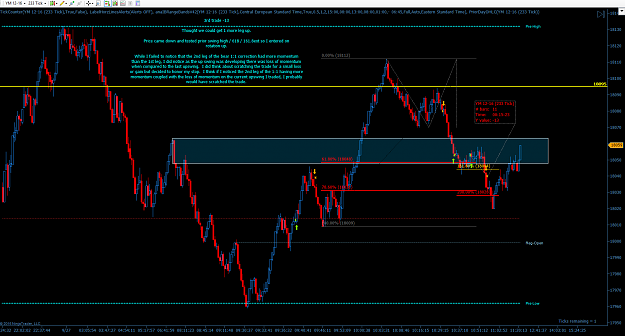
Attached Image (click to enlarge)
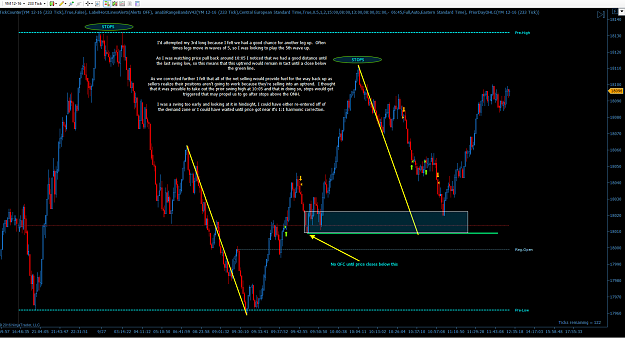
Attached Image (click to enlarge)
Sometimes the fade move is one swing while sometimes it's multiple swings.
Sometimes the fades happen very early, other times it could take a little while.
Sometimes the move fills the gap and sometimes it doesn't.
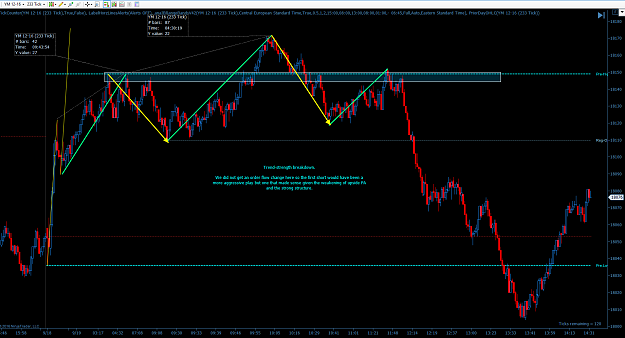
Sometimes these don't work at all.
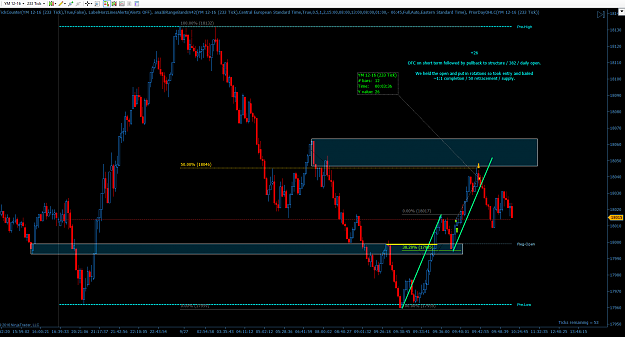
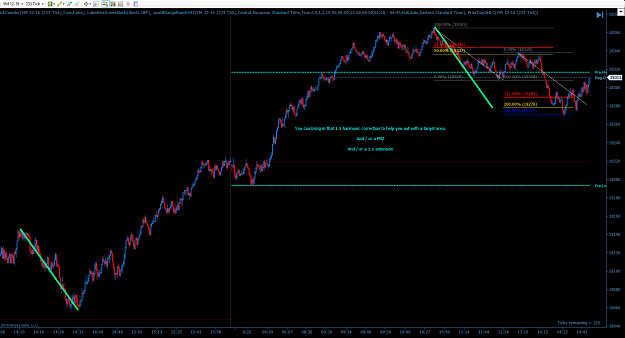
Also higher odds of finding a quality setup if the trend is exhausting in a PRZ.
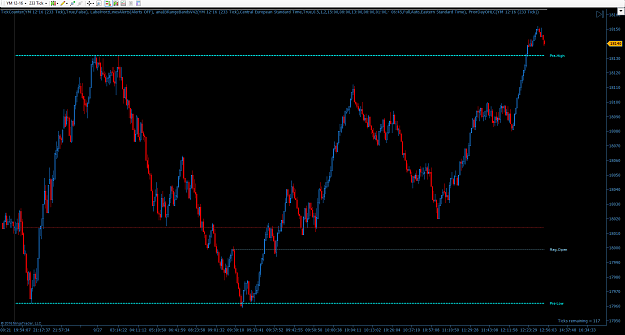
Attached Image (click to enlarge)