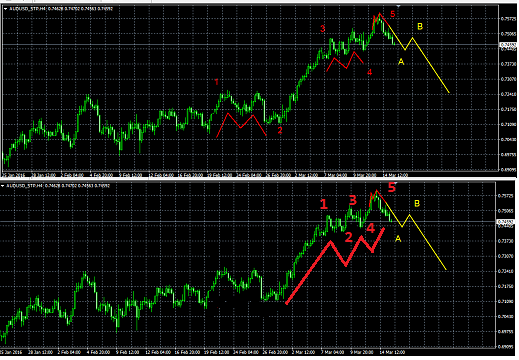
I think it's more likely a further decline, as I believe wave 5 completed. But if we assume punched level 50, the growth is possible to 38.2 and then drop down to 50 or lower.
According EurUSd forecast remains the same as the one that I made 29/07. Now the price on the upstream channel and possibly its extension to 38.2. But at the same time, now the price is at the top of the rectangle, which I drew earlier. Therefore, it is now met with resistance and probably fall under the wave theory.
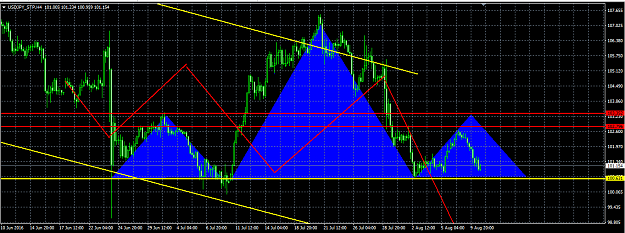
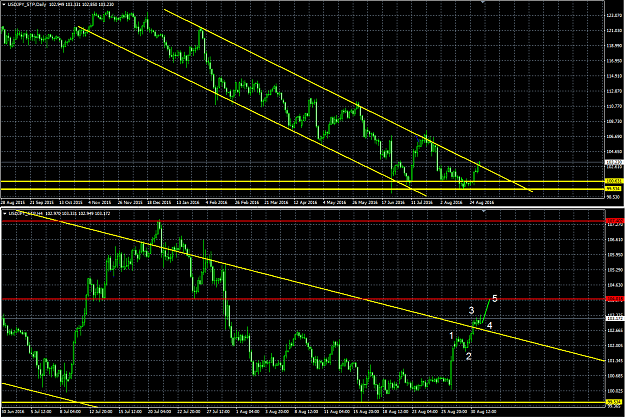
USD / JPY continues to go according to my prediction. Price reduction according to the trend, completing wave 5. Thus, on the way to support that price can not bridge. Thus, it is likely that this support 100,631, will be the turning point for further growth. If this level is overcome, the decline will continue until it touches the bottom border of the trend.
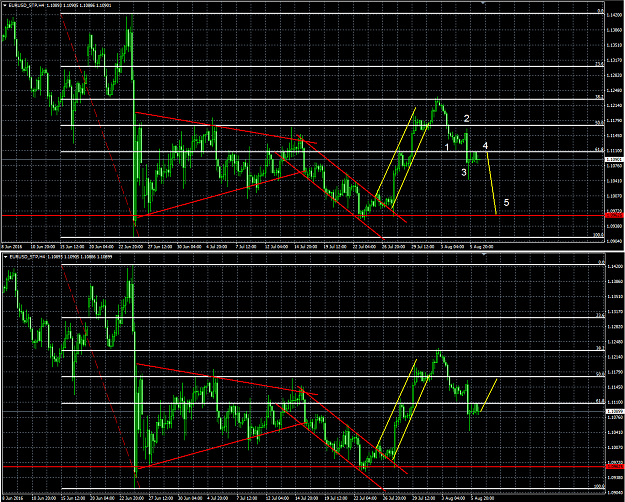
The forecast for the pair EUR / USD. We can see that now ending wave 4 and is likely to form a wave 5. This means that we expect a further fall down to the level of area 100. We can see the price after the rebound from the level of 38.2 start falling and stops at 50.0 and 61.8. Now, while the price is at a level of 61.8, we can expect growth to test the 50 fib.
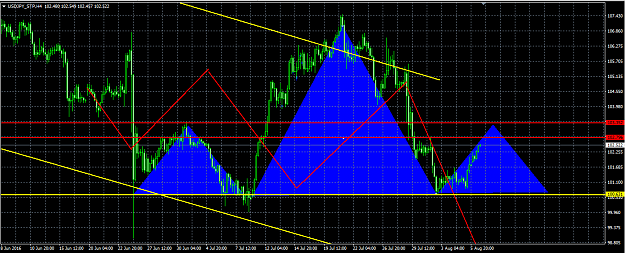
The outlook on the pair USD / JPY. As I said earlier, the price stood at 100,631 after the fall, and then began to rise. At the same time, this growth may continue to level up to 102,796 or 103,352. In this case, the figure head and shoulders is formed. At the same time, it is possible to break the resistance levels and further growth, and then, out of the falling trend. But probably 100,631 and a continuation of the level of testing.
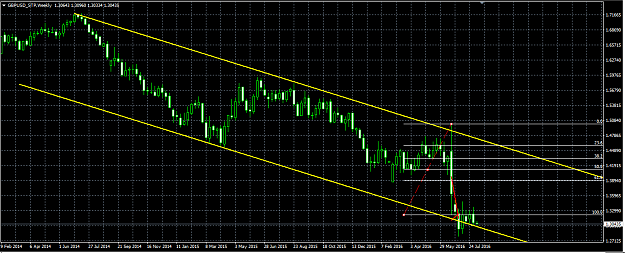
What do you think of this one? GBP/USD /monthly probably up in next weeks? {image}
Ignored
Sorry for the long time answer. I believe that now is a long stagnation in the level of support. At the same time, we can expect movement on the trend, up, thus, will reach the mark 61.8.
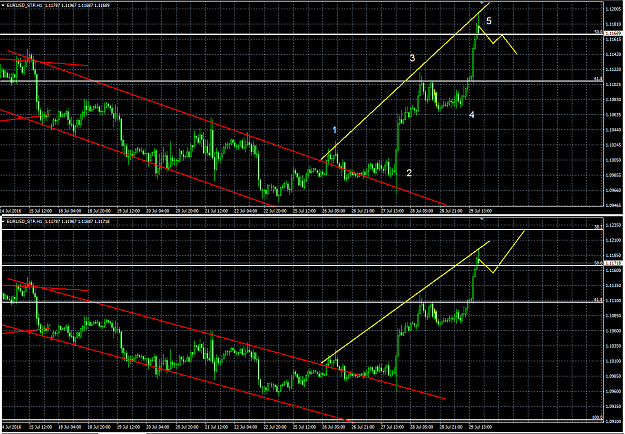
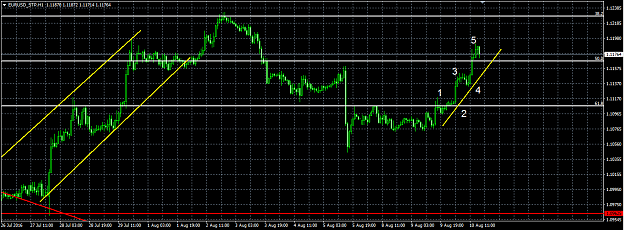
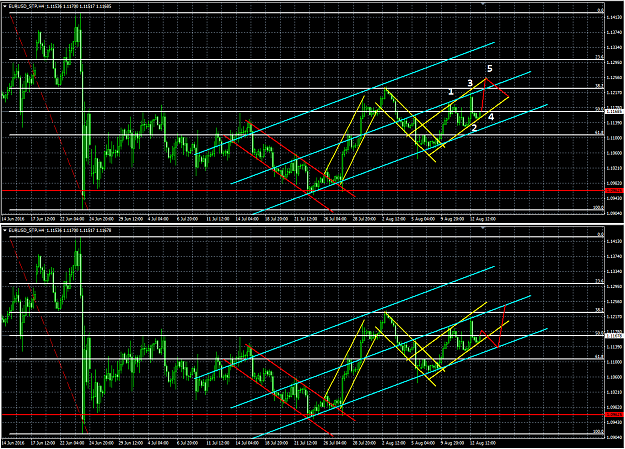
The forecast for the pair EUR / USD. We can see that now ending wave 4 and is likely to form a wave 5. This means that we expect a further fall down to the level of area 100. We can see the price after the rebound from the level of 38.2 start falling and stops at 50.0 and 61.8. Now, while the price is at a level of 61.8, we can expect growth to test the 50 fib. {image}
Ignored
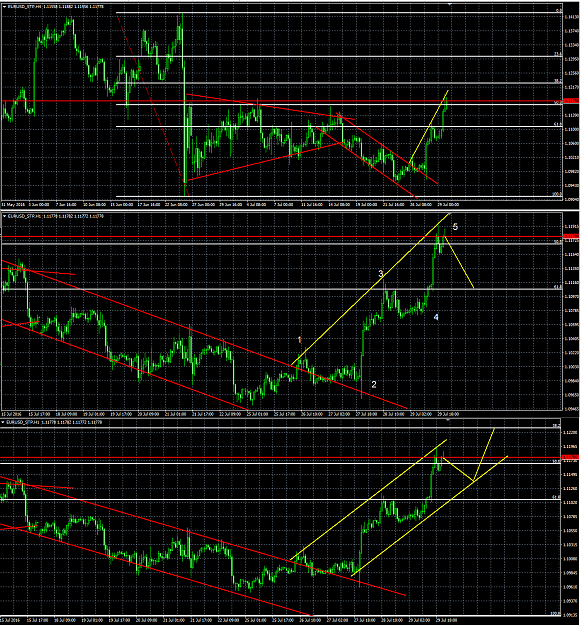
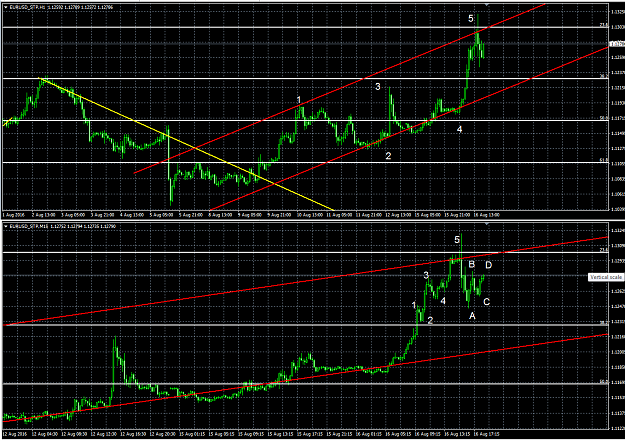
As you can see, my forecast was justified, the level reached 50 Fib. Further developments - the decline to 61.8, and the formation of correction. Do not exclude a further increase to 38.2.
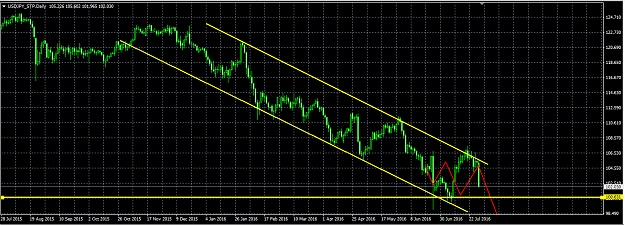
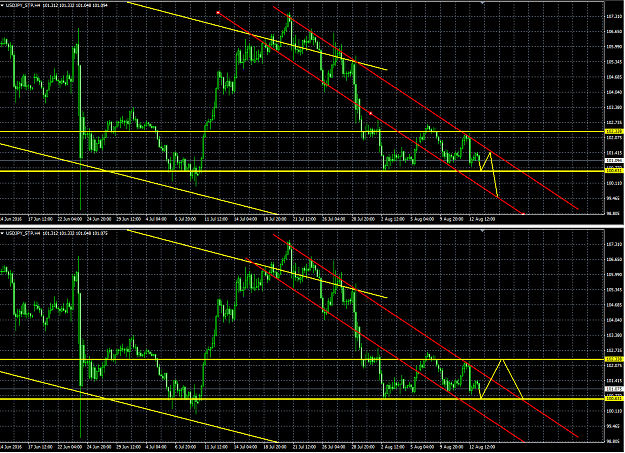
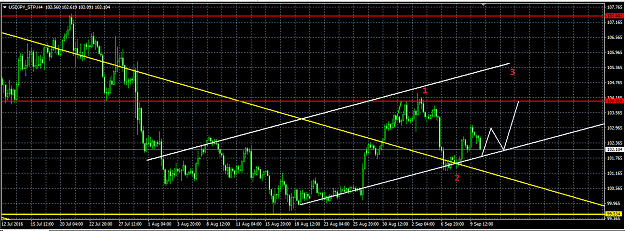
The outlook on the pair USD / JPY. As I said earlier, the price stood at 100,631 after the fall, and then began to rise. At the same time, this growth may continue to level up to 102,796 or 103,352. In this case, the figure head and shoulders is formed. At the same time, it is possible to break the resistance levels and further growth, and then, out of the falling trend. But probably 100,631 and a continuation of the level of testing. {image}
Ignored
It is also true forecast for USD / JPY. shoulder formation is almost over
U/J. Probably decrease according to the trend, if the support level is broken (100.631)
At the same time, the price is in the middle of the trend line on the D1.
If the level (100,631) is not broken, the price will probably continue to move between 100,631 and 102,338. This means that after touching 100,631 next target would be 102,338. After the correction is expected to continue reduction according to the trend.
E/U. Perhaps the formation of continuation of wave motion and further growth within the wave 5. After that - the correction will be formed, rebound from 38.2. uptrend forming now, so the long-term growth is more likely.
If the level is 50, will not be broken in the near future, it will form a small downward movement as testing the lower boundary of the uptrend.
|
Additional Username
|
Joined Mar 2016
|578 Posts
Making regular profit is not always possible. The market is volatile that sometime you can make a lot of money, and other time you would face huge losses. You can't avoid losses at all.
Having read all the posts, I see that you are a very talented trader using Elloitt wave theory.
I struggle with how to apply these theory. I have a question, it is actually very basic, where and how do you start marking the impulsive wave 1?
For example, looking at post 130 , any reason you decide to mark the wave 1 the way where it is?
Also, I read that in post 185 and 148, you proclaimed that the wave 5 is finished, before price actually reversed. Based on what elloitt wave principle do you tell that a wave 5 is finished? Fib extension target? Or minor 5 wave strucutre finished on the lower timeframe?
Hi Dennis, Having read all the posts, I see that you are a very talented trader using Elloitt wave theory. I struggle with how to apply these theory. I have a question, it is actually very basic, where and how do you start marking the impulsive wave 1? For example, looking at post 130 , any reason you decide to mark the wave 1 the way where it is? Also, I read that in post 185 and 148,...
Ignored
Thank you for your post. I'll be glad to answer your questions.
With regard to post 130:
Then there were 2 options for building waves. The second option is that the wave 1 is built instead of wave 3. In this case, the end result does not change. I decided to use that variant, because I saw a repetition of the two-headed groups and took them for a wave, so the first generation was the beginning of wave 1.
Post 148
I see the formation of the five-wave movement after the turn, and therefore took such a decision.
Post 185
Similarly, I saw 3 sharp upward impulse, which served as the formation of five waves.
In order to determine the beginning of the wave motion, I often use the Fibonacci to determine levels. Or spend a line level without a grid. I also sometimes use the figures to determine the turning points.
The beginning of the first wave may be a reversal movements within the trend channel or break the trend. Lately, I often use the theory of the trend, to determine the direction and possible reversal points.
I also use different time frames in order to determine the completion of a concrete wave. Example in the picture.
{quote} Thank you for your post. I'll be glad to answer your questions. With regard to post 130: Then there were 2 options for building waves. The second option is that the wave 1 is built instead of wave 3. In this case, the end result does not change. I decided to use that variant, because I saw a repetition of the two-headed groups and took them for a wave, so the first generation was the beginning of wave 1. Post 148 I see the formation of the five-wave movement after the turn, and therefore took such a decision. Post 185 Similarly, I saw 3...
Ignored
)
Hi Dennis,
Thanks a lot for the detailed answer. It shows a lot of insights. Here's some of my interpretation of your word. I am trying to grasp and understand better. My understanding could be wrong, and I would appreciate if you would point out if my understanding is wrong.
Below are the original word and my questions are written in italic.
Then there were 2 options for building waves. The second option is that the wave 1 is built instead of wave 3. In this case, the end result does not change. If wave 1 is built instead of wave 3, why would the end result (i.e. prediction for an A-B-C correction) does not change?
In order to determine the beginning of the wave motion, I often use the Fibonacci to determine levels. Yes I see that you often use Fibonacci (for example, in post 388) , but I am struggling see how that relates to finding the beginning of a wave motion. How to use Fibs to find the beginning of a wave? Do you mean, for example, when a move retrace precisely to 61.8% of a previous move, then we call this move wave 2 and the previous move wave 1?
Or spend a line level without a grid. I am trying to understand the word "spend a line level", what do you mean by "line level" and "grid"?
Also in Elloitt principle, wave 3 should not be the shortest wave among 1,3,and 5. Do you use such a rule for marking waves? Or is it more based on what you see on the chart? I asked this because I see that sometimes the wave 3 in your chart is the shortest one.
Thanks a lot for the detailed answer. It shows a lot of insights. Here's some of my interpretation of your word. I am trying to grasp and understand better. My understanding could be wrong, and I would appreciate if you would point out if my understanding is wrong.
Below are the original word and my questions are written in italic.
Ignored
Hello. How are you?
Quote
Disliked
Then there were 2 options for building waves. The second option is that the wave 1 is built instead of wave 3. In this case, the end result does not change. If wave 1 is built instead of wave 3, why would the end result (i.e. prediction for an A-B-C correction) does not change?
Yes you are right. I think that in the picture will be clearer. Please take into account that my prediction is not idiale and I work hard to improve my skills.
Attached Image
Quote
Disliked
In order to determine the beginning of the wave motion, I often use the Fibonacci to determine levels. Yes I see that you often use Fibonacci (for example, in post 388) , but I am struggling see how that relates to finding the beginning of a wave motion. How to use Fibs to find the beginning of a wave? Do you mean, for example, when a move retrace precisely to 61.8% of a previous move, then we call this move wave 2 and the previous move wave 1?
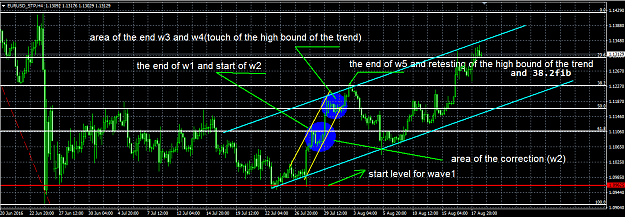
I'm starting to build a wave after the turn after touching the significant levels. That is, the start of wave 1 is 100 Fibo level, this movement will face resistance at first 61.8 - is likely the end of wave 1 and the beginning of wave 2. Then it will be a correction, which acts as a wave 2. Renewal movement and testing of new levels - it further construction of wave motions.
Attached Image (click to enlarge)
Quote
Disliked
Or spend a line level without a grid. I am trying to understand the word "spend a line level", what do you mean by "line level" and "grid"?
I meant that it is possible to build a significant level, without Fibonacci.
Quote
Disliked
Also in Elloitt principle, wave 3 should not be the shortest wave among 1,3,and 5. Do you use such a rule for marking waves? Or is it more based on what you see on the chart? I asked this because I see that sometimes the wave 3 in your chart is the shortest one.
Wave 3 commonly believed the longest. But I do not always see this dependence.
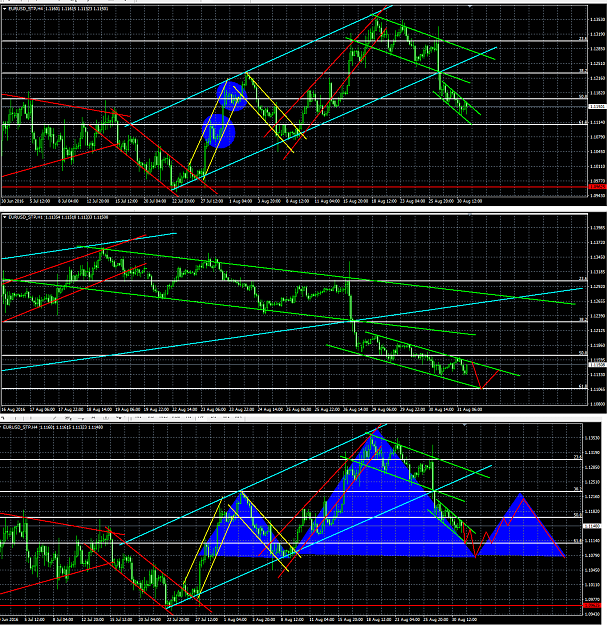
My forecast for the pair EUR / USD.
I see movement in the downward trend, thus, there was penetration of older uptrend. Now expected to fall to the level of 50 fib. I do not rule out the likelihood of a return to a level of 38.2 and testing
The longer term - is the formation of the second shoulder, the continuation of the figure's head and shoulders.
It is also possible breakdown of the 61.8 level right up to the level of 1.09625. Care must be taken when trading near levels 50 and 61.8
Forecast USD / JPY.
If continue the movement according to the downtrend, then we can talk about selling. If the channel is broken we can expect growth to levels 104,018 and 107,402.
In the short term, the formation of a wave 5 and to rise to 104,018.
The forecast on pair of U / J
I see that the movement began to exit from the downtrend. At the same time, have formed two waves, one can expect a third wave, which will mean a minimum increase to the level of 104,018.
It is also possible option to return to the trend and test 99,534 again.