Hello fellow traders. Recently I got interested in the whole concept of candle stick charts as we know them (Time based) flows.
Infact even Steve Nison said on one of his webinars that he doesn't time the market. So... after thinking for some time, I believe that I found out the reason to why time based charts show a less clearer picture of the market, and in fact candles them selves can be labeled as indicators since they plot OHLC data in time based vertical rectangles with wicks. The reason is volatility as I believe, it changes through out the day. For example in the quiet times in a minute on EURUSD only 37 ticks could go through, however during more active times even 120 ticks could go through the same minute. Due to this, time based candles either create mess or hide important micro trend valleys and picks and etc...
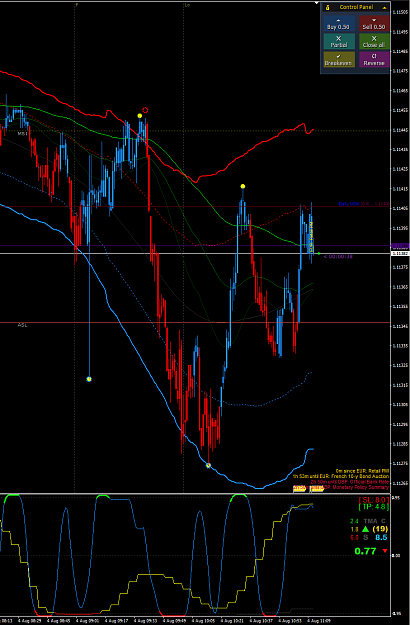
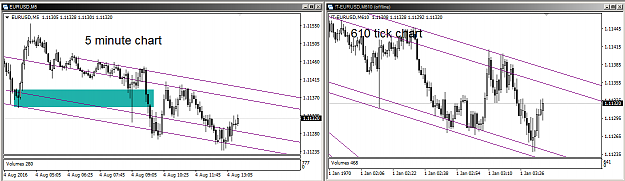
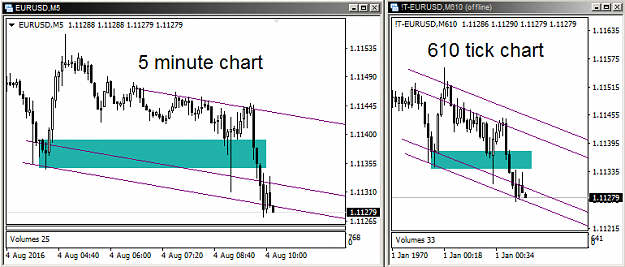
Benefits of tick charts I found out so far: If matched correctly with your desired time frame, you may see a much better picture suitable for technical analysis and especially for trend lines. I will provide an example below :
Infact even Steve Nison said on one of his webinars that he doesn't time the market. So... after thinking for some time, I believe that I found out the reason to why time based charts show a less clearer picture of the market, and in fact candles them selves can be labeled as indicators since they plot OHLC data in time based vertical rectangles with wicks. The reason is volatility as I believe, it changes through out the day. For example in the quiet times in a minute on EURUSD only 37 ticks could go through, however during more active times even 120 ticks could go through the same minute. Due to this, time based candles either create mess or hide important micro trend valleys and picks and etc...
Benefits of tick charts I found out so far: If matched correctly with your desired time frame, you may see a much better picture suitable for technical analysis and especially for trend lines. I will provide an example below :
Attached Image (click to enlarge)
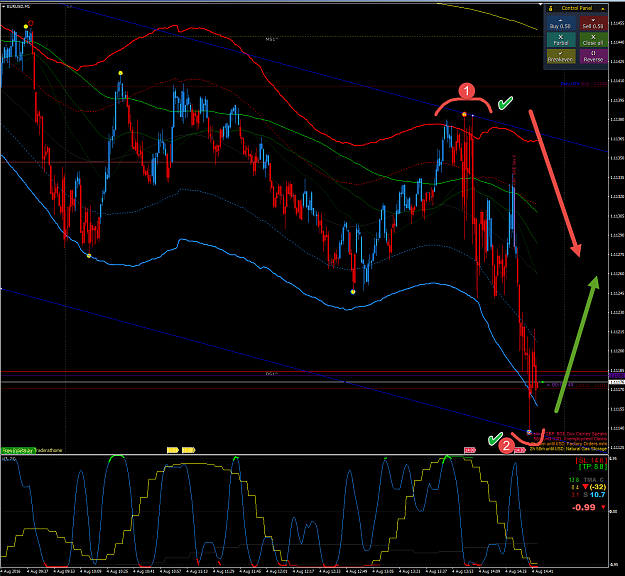
The truth is hidden from you