{quote} The set file is enclosed but I would be looking for a slightly different scenario - that is EMA 5 crosssing above EMA 12 and RSI greater than 50 for a buy, and a reverse scenario for a sell. {file}
Ignored
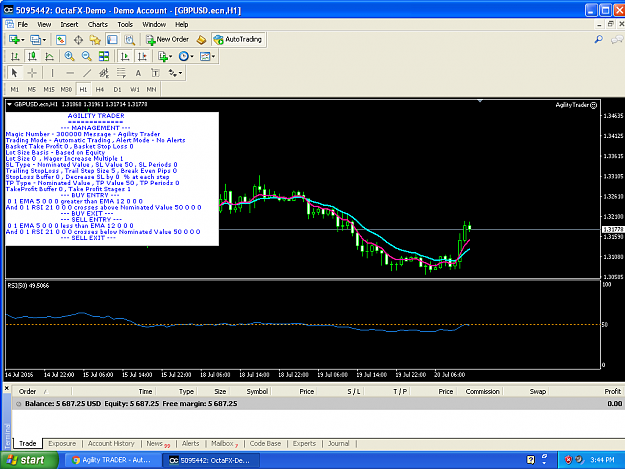
i have loaded the strategy and EA also shows running mode but no any buying/selling entries are taken by it.
{quote} i have loaded the strategy and EA also shows running mode but no any buying/selling entries are taken by it.
Ignored
I need a copy of your set file, the currency pair and timeframe, a screen shot of your chart and journal as the minimum requirements to be able to help you.
|
Commercial Member
|
Joined Jun 2009
|1,676 Posts
A HITCH HIKERS GUIDE TO PROFITABLE TRADING - fourth instalment
===============================
The effect of News releases and how to trade them
I have mentioned in my previous instalments that the one thing that drives the market is weight of money however we have no idea of the values of trades being executed unlike trading stocks. It is the news releases that cause the major institutions to make market moves and you always need to have the economic time table at your disposal when you are trading. There are many web based instances and the most popular is right here in Forex Factory but there are some very able competitors such as MyFxBook and ForexPeacyArmy among others. Look in the forums here for scripts which advise on your charts of upcoming news events.
How to you trade news events. During the news release - not at all. The latency of your connection, the speed of the dissemination of information, the widening of spreads and the volatility all work against the individual trader. There are some Web based services that will charge for sophisticated software that will supposedly give you the upper hand. My advice is to forget about it. There are some completely free services which make a good attempt to provide trading software. You can try a straddle trade before the event. That is a Stop Buy and a Stop Sell, one or both of which may automatically trigger once the market makes a move. Whipsawing around the event can kill the validity of these types of trades. This link provides such free software http://www.currencynewstrading.com/cnt-news-trading-ea/.
Here is another gem - Forex News Gun. This one simulates mouse presses on your buy and sell buttons as soon as the info is available.
My own preference is to wait until the market has settled down (around 15 to 30 mins depending on volatility) and then decide whether a buy, sell or even possibly a straddle trade is appropriate at that time. Sure you will miss the major initial move, but if the news is significant, the market will continue moving, even for a number of days. Don't forget it is quite common to see a pullback. Analyze the same news event's chart movement on previous releases to get a feeling for what happens under certain deviations from the forecast. Just remember it is not the size of the change but the deviation from forecast that moves the market.
I prefer to have CNBC or Bloomberg running when these releases are made because you are able to hear real time commentary.
The final word - Do your homework - even consider subscribing to the services which provide pre-release commentaries and advice on how to trade the moves. The more information you have in advance, the sounder your decision making will be. Even consider printing out charts of previous occurrences of the same event. Always remember to monitor the major news not just the economic news. Such an example was the major tsunami in Northern Japan's effect on the JPY.
Forex can be very volatile and your stop losses can be snapped up in an instant with major slippage so my advice is not to be trading during major economic events. Remember, even if you get it right, the whipsawing around the release can take out your stop losses.
{quote} I need a copy of your set file, the currency pair and timeframe, a screen shot of your chart and journal as the minimum requirements to be able to help you.
Ignored
please check that EA is active from yesterday but no any order taken by it.
Hi, Dave. I'm enjoying your posts.
When you make an update, is it necessary to uninstall every time or can we just install the updated version to our programs file and launch from there?
Thank you.
Hi, Dave. I'm enjoying your posts. When you make an update, is it necessary to uninstall every time or can we just install the updated version to our programs file and launch from there? Thank you.
Ignored
The exe update (uploaded as a AgilityTrader2.zip) at the bottom of a new post is provided so you don't have to repeat the full installation. Just overwite the exe in the Program Files area.
Occasionally I will recommend a full update as in Post #870.
|
Commercial Member
|
Joined Jun 2009
|1,676 Posts
If you are having difficulty in connecting to MT4 with the companion, it is most likely that you don't have the 14 pairs used in the companion enabled within MT4, notably AUDNZD and GBPAUD.
|
Commercial Member
|
Joined Jun 2009
|1,676 Posts
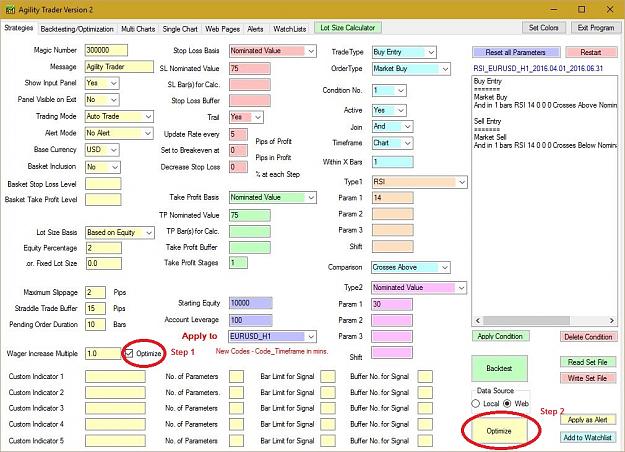
Here is a good example of the Wager Increase Multiple at work. Just open the companion, click on the wager increase check box and then click on optimize. Note the wager increases.
Hi Dave, interesting to see the WIM at work, I had been playing with that particular example.
Are the Optimise with and without WIM the same, i.e. can you do them either way round and the WIM if actioned first will not optimise the parameters?
Although optimising the parameters can have some tempting results, I would think because there are a multiple of combinations they would be hit & miss in other periods whereas the WIM is only based on one factor and thus more reliable.
Also I have been trying to re-create the RSI Continuous Set as it had shown good results (H4) previously to AT2 whereas now it doesn't provide any. If my memory serves me right it was the same in AT1 and you wrote a separate exe for me. Could you check to see if it can work now.
Hi Dave, interesting to see the WIM at work, I had been playing with that particular example. Are the Optimise with and without WIM the same, i.e. can you do them either way round and the WIM if actioned first will not optimise the parameters? Although optimising the parameters can have some tempting results, I would think because there are a multiple of combinations they would be hit & miss in other periods whereas the WIM is only based on one factor and thus more reliable. Also I have been trying to re-create the RSI Continuous Set as it had shown...
Ignored
If you activate the Wager Increase Mutiple after you have already performed an Optimize, the optimization will be done using the Optimized values as the base values rather than the original values as the base values.
I would suggest that if you are performing optimization using the Multiple that you check the Wager Increase option before you optimize.
|
Commercial Member
|
Joined Jun 2009
|1,676 Posts
A HITCH HIKERS GUIDE TO PROFITABLE TRADING - Fifth instalment
===============================
What is 2% of equity and how should it be used - This the generally accepted prudent amount to risk on a single trade.
You need to clearly understand that 2% represents the maximum amount to lose on a trade. It should take into account the spread plus commission if any, plus overnight swaps (interest charges for positions held overnight).
So if a 50 pip stop loss represents 2% of your equity, you should really be using a 47 pip stop loss to take into account the above factors. The important thing to note is that it is not the size of your wager but the size of your potential loss. As I mentioned 3 days ago, there are a number of factors affecting the size of your wager including leverage and stop loss. The lower the stop loss and leverage, the higher the wager can be to maintain the 2% stop loss.
I have included a Lot Size calculator in the companion program. Just one point of note concerning it's usage. The exchange rate required is the exchange rate between your base currency and the first of the pair being traded - for example trading EURUSD using AUD as base currency, the exchange rate is AUDEUR - this is not a quoted pair so the rate is 1/EURAUD. I wiil endeavour in the future to implement an automatic lookup and conversion
I have introduced the Wager Increase Multiple as a concept (a variation of the Martingale principle - see Post #58) which will exceed the 2% stop loss in principle and you could even consider a starting equity much lower than 2% in this case.
Hi Dave, The Lot Size Basis default is Based on Equity. Given your comments above would it be safer to switch this to Based on Equity and Stop Loss? Could you give examples as to the implications and how they differ? Many Thanks Alan
Ignored
After my commentary yesterday, and your observation, I ran the program with the wager setting based on "Equity and Stop Loss" and received no profitable projections so I went back and examined the code and found the following error.
If cbo_LotSizeBasis.Text = "Based on Equity and StopLoss" Then
should be
If cbo_LotSizeBasis.Text = "Based on Equity and Stop Loss" Then
As a result I have enclosed an amendment below and changed the default to "Based on Equity and Stop Loss".
Whilst the results on optimization look great with the Wager Increase Multiple enabled, I would advise cutting down the Equity Percentage. The reason for the greatly improved results is that the lot sizes increase when the Stop Loss is less than 100 pips with Wager being based on Equity and Stop Loss.
EDIT: Updated download to respect margin requirements on Wager Increase mode. Note - be aware of increased margin values with higher leverages
|
Commercial Member
|
Joined Jun 2009
|1,676 Posts
A HITCH HIKERS GUIDE TO PROFITABLE TRADING - Sixth instalment
===============================
Committment of Traders and how to apply it. These reports are produced weekly by the Commodities Futures Trading Commission and apply to all types of Commodities including FX. There are 3 types of Traders contained in each COT report,
Commercial Traders
Non Commercial Traders
Non Reporting Traders
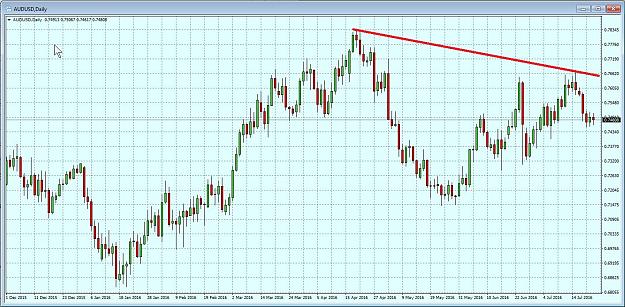
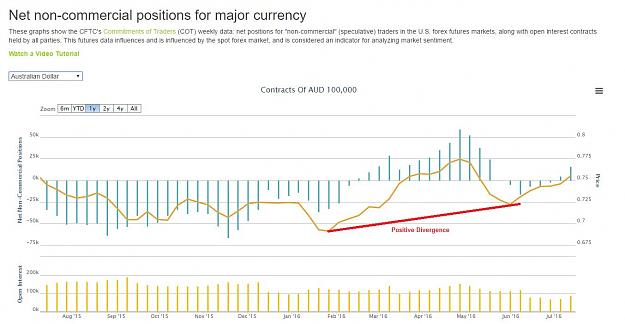
We are interested in the Non Commercial Traders because this group represents the large speculators such as Banks and large Hedge Funds who have no interest in offsetting risk on future prices but are simply speculating on future price direction. The main reports are sourced here but there are a number of third party providers who amalgamate the information and present it in a more logical format. We are particularly interested in the trends of the Non Commercial Traders and how that relates to price action. For instance, if the trend of this group is to reducing short positions but the price of the currency against the USD is still falling, that may be the sign of an imminent reversal of prices.
This report is suitable for Long Term Traders. It is not particularly useful for day traders other than giving an idea of the long term trend
The general idea is to trade in the same direction as the large speculators but to be aware of divergence between the COT chart and the Daily Price chart.
|
Commercial Member
|
Joined Jun 2009
|1,676 Posts
A HITCH HIKERS GUIDE TO PROFITABLE TRADING - seventh instalment
===============================
Fibonacci, Pivot Points and Elliott Waves. Along with the next instalment on Support and Resistance, this discussion as all about psychological levels encountered in trading which can cause a temporary halt or even reversal in trading conditions and need to be considered for the positioning of Stop Loss or Take Profit decisions.
Firstly Fibonacci, the developmental growth of items in nature, the planets and life bear some relationship to human psychology. The sequence of rise an decline of a price pattern has stumbling blocks at 23.6,38.2, 50, 61.6, 76.4 percent in decline and similar in rise above a previous price. When the sequence develops, each previous number is 61.8% of the next number as in 0,1,1,2,3,5,8,13,21,34,55,79. So when a price rises and hits a peak but then reverses, you can expect hesitations at the 23.6, 38.2, 50 and 61.8 deviations from the max level. These are the points where you can expect hesitation and you should consider stops at these levels. If I were to single out 2 for clarity, consider 38.2 and 61.8 levels for TP and SL.
Pivot Points are levels relating to most immediate previous period of trading and normally considered on a daily basis. End of day is not necessarily end of calendar day but could be end of trading day such as Dow close.
(Pivot Point for Current Period = (High (previous) + Low (previous) + Close (previous)) divided by 3
Support and Resistance points place more weight on the Lows and Highs of the previous period
The important thing to consider is the first Support Level S1 and first Resistance Level R1 for the following reason
The actual low has been lower than S1 892 times, or 44% of the time
The actual high has been higher than R1 853 times, or 42% of the time
The actual low has been lower than S2 342 times, or 17% of the time
The actual high has been higher than R2 354 times, or 17% of the time
The actual low has been lower than S3 63 times, or 3% of the time
The actual high has been higher than R3 52 times, or 3% of the time
Elliott Waves support the theory that trading takes place in waves. The primary waves being described below
Attached Image
The application of Elliott waves can be quite subjective - that is my interpretation can differ from yours, but the above rules do appear to be set in stone.
A good reference is here - http://stockcharts.com/school/doku.p...tt_wave_theory
THE FINAL POINT - be aware of all these psychological levels when setting your Stop Loss and Take Profit positions and never get too greedy. There is always another day. These levels are real and apply to both Large and Small Traders.
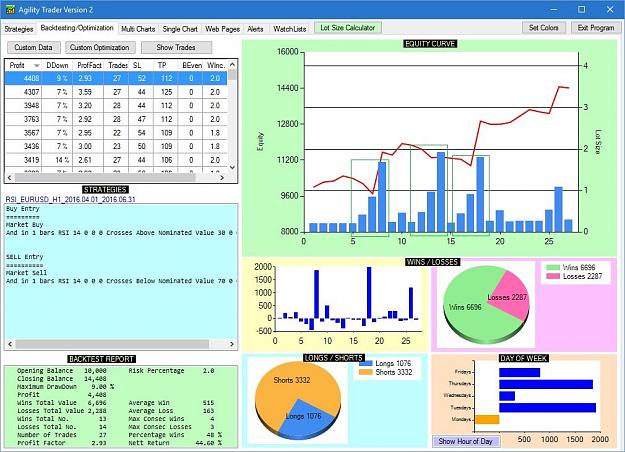
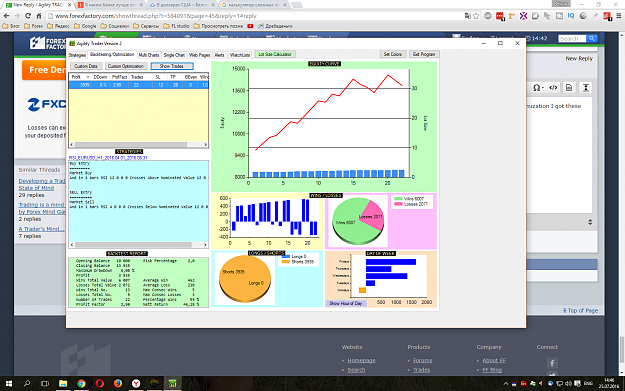
Hello. Can someone enlight me please. When I doing backtesting in companion programm Using RSI set file on EURUSD H1 after doing optimization I got these results, which is great
Attached Image (click to enlarge)
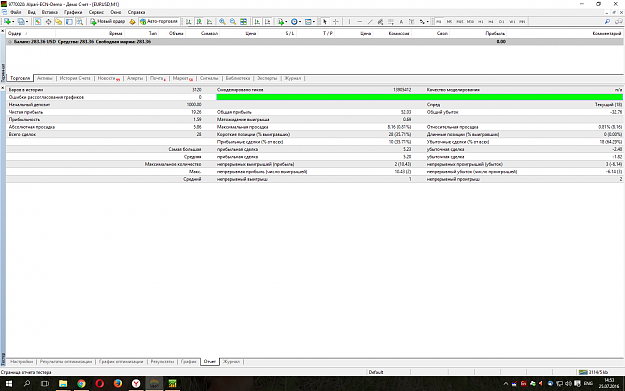
I have edited EA parameters in MT4 tester according optimization results and test it again on the same TF, pair and period. The result is very different.
Attached Image (click to enlarge)
Sorry, there is russian MT4 localisation on screenshot, but it still can be understandable I believe.
So why results are so different? I use Tickstory lite imported tick data. And yes, I am EA newbie.
Hello. Can someone enlight me please. When I doing backtesting in companion programm Using RSI set file on EURUSD H1 after doing optimization I got these results, which is great {image} I have edited EA parameters in MT4 tester according optimization results and test it again on the same TF, pair and period. The result is very different. {image} Sorry, there is russian MT4 localisation on screenshot, but it still can be understandable I believe. So why results are so different? I use Tickstory lite imported tick data. And yes, I am EA newbie.
Ignored
I need a copy of your set file and your test date range and a copy of your equity graph.