First of all a big thank you for the guys from the TMS thread, this strategy is a kind of derived from that thread, there are a couple of reasons why I don't trade TMS any more, firstly I'm not very good at it! My psychology for it is poor, secondly I don't have the time at the moment, and so my posting to this thread might well be sporadic, infrequent and short, so I will try my best to get this first post concise and clear (it would be handy if FF would allow editing posts long term, but hey ho that's the way it is)
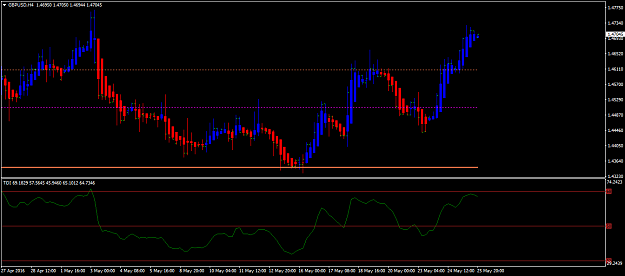
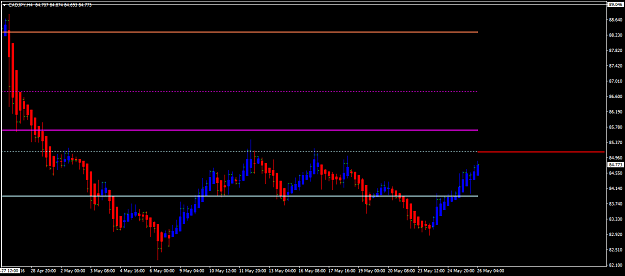
4Hr Chart.
I use the 4hr chart because you can generally forget about news announcements, it's the smoothest chart before going to the daily which won't really give you the profit the 4hr chart will, the daily chart is 'slower' to a factor of 6, 6 being the 6 in 6 times 4 making 24 hrs. It's the easiest chart to read that will potentially give enough profit.
Heiken Ashi
I use Heiken Ashi candles, because it makes the chart easier to read, when the colour changes it indicates a trend reversal, long wicks do indicate a potential reversal. And that is all I read into it, forget candlesticks, my basis for this is, look at a Heiken Ashi Chart and look at a candlestick chart, it's easier to read.
Pivot Points.
I use pivot points for support and resistance, it's for simplicity again. I used to draw my own support and resistance, but are they in the right place? Who knows? And how often do you look at the chart and think, Oh I missed a trade because I should have placed a support or resistance line somewhere. Using Pivot Points, removes this dilemma. I use Monthly and Weekly pivot because they are best suited for the 4hr timeframe. I've modified the pivot indicators to show only the current points all the way along the chart, this is reduce thinking again, what happened on that pivot last week or last month and so on, what happened before has happened we don't want to be thinking or looking at it to cloud our trading descisions, forget it, it's only the current pivots were interested in and if they confluence with previous support and resistance.
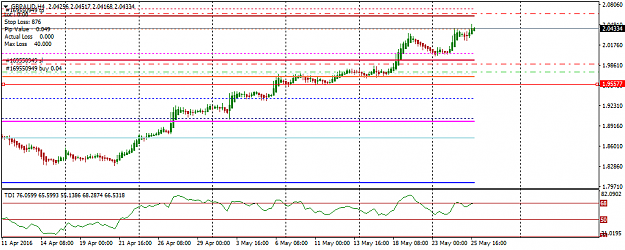
TDI.
I use the TDI indicator to look for divergence, it became my favourite indicator after trading TMS, you could use your preferred Oscillator for this purpose.
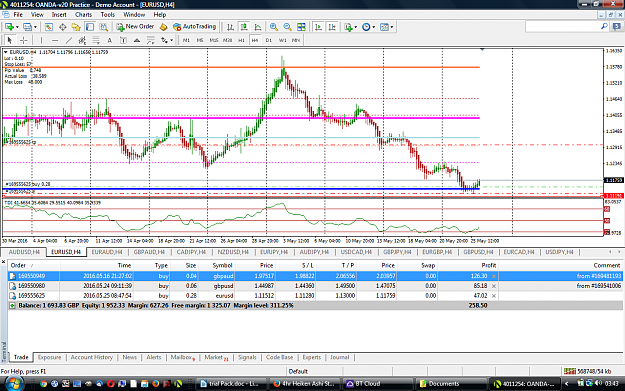
Position Size.
I use this indicator on my chart because it shows me exactly how many lots I should put on to risk a certain amount of money, as I start this thread it's at 40 risk per trade. Again it's for simplicity, I don't need to do any calculations for position sizing, it's on my chart.
Tuesday And Wednesdays.
I generally place trades on Tuesdays and Wednesdays, generally I think on Mondays the market does whatever, the often on Tuesdays it decides which way it's heading for the week, so it's a good time to place trades, then Wednesdays I think is second best for opportunities, not disregarding that opportunities can turn up at any time.
Rules.
Aim to trade from one pivot to another, look for trades where you get at least a 3:1 R/R, enter when the candle changes colour.
I have linked to myfbook.com to show how I progress, http://www.myfxbook.com/portfolio/4hr-ha-pivot/1644262 , it doesn't really show much at the moment except that I've been breaking even for just over 2 months and now moving into profit, so not bad going for Forex as it is I don't think as I was developing the strategy, and we know how hard it can be not to lose money, but hopefully over the next couple or three months we will see some real progress.
This plan is all about making trading as easy as possible and taking as much thinking as possible out of it.
I have been trading for very very long long time, so I know what I'm on about, will this prove my ultimate system that will at last show me some consistent and decent profits and spending very little time trading? I believe that, you have to, and I think it will suit a few other traders too. It is a demo account on myfxbook and no, I'm not trading live at the moment, but I soon will be again. So lets see if this will lead us to where we want to be....
Some of this goes against the grain of some other trading strategies, but we are not trading other strategies, we are trading this one, and there is reasoning behind it and the indicators.
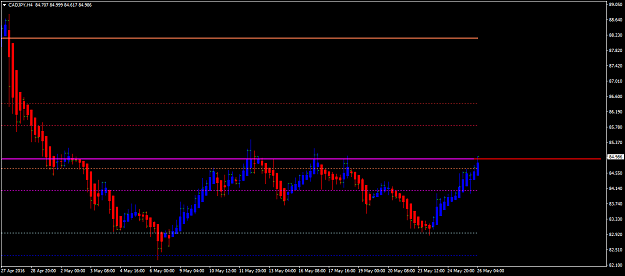
4Hr Chart.
I use the 4hr chart because you can generally forget about news announcements, it's the smoothest chart before going to the daily which won't really give you the profit the 4hr chart will, the daily chart is 'slower' to a factor of 6, 6 being the 6 in 6 times 4 making 24 hrs. It's the easiest chart to read that will potentially give enough profit.
Heiken Ashi
I use Heiken Ashi candles, because it makes the chart easier to read, when the colour changes it indicates a trend reversal, long wicks do indicate a potential reversal. And that is all I read into it, forget candlesticks, my basis for this is, look at a Heiken Ashi Chart and look at a candlestick chart, it's easier to read.
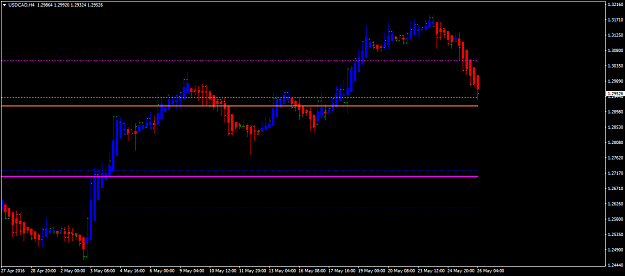
Pivot Points.
I use pivot points for support and resistance, it's for simplicity again. I used to draw my own support and resistance, but are they in the right place? Who knows? And how often do you look at the chart and think, Oh I missed a trade because I should have placed a support or resistance line somewhere. Using Pivot Points, removes this dilemma. I use Monthly and Weekly pivot because they are best suited for the 4hr timeframe. I've modified the pivot indicators to show only the current points all the way along the chart, this is reduce thinking again, what happened on that pivot last week or last month and so on, what happened before has happened we don't want to be thinking or looking at it to cloud our trading descisions, forget it, it's only the current pivots were interested in and if they confluence with previous support and resistance.
TDI.
I use the TDI indicator to look for divergence, it became my favourite indicator after trading TMS, you could use your preferred Oscillator for this purpose.
Position Size.
I use this indicator on my chart because it shows me exactly how many lots I should put on to risk a certain amount of money, as I start this thread it's at 40 risk per trade. Again it's for simplicity, I don't need to do any calculations for position sizing, it's on my chart.
Tuesday And Wednesdays.
I generally place trades on Tuesdays and Wednesdays, generally I think on Mondays the market does whatever, the often on Tuesdays it decides which way it's heading for the week, so it's a good time to place trades, then Wednesdays I think is second best for opportunities, not disregarding that opportunities can turn up at any time.
Rules.
Aim to trade from one pivot to another, look for trades where you get at least a 3:1 R/R, enter when the candle changes colour.
I have linked to myfbook.com to show how I progress, http://www.myfxbook.com/portfolio/4hr-ha-pivot/1644262 , it doesn't really show much at the moment except that I've been breaking even for just over 2 months and now moving into profit, so not bad going for Forex as it is I don't think as I was developing the strategy, and we know how hard it can be not to lose money, but hopefully over the next couple or three months we will see some real progress.
This plan is all about making trading as easy as possible and taking as much thinking as possible out of it.
I have been trading for very very long long time, so I know what I'm on about, will this prove my ultimate system that will at last show me some consistent and decent profits and spending very little time trading? I believe that, you have to, and I think it will suit a few other traders too. It is a demo account on myfxbook and no, I'm not trading live at the moment, but I soon will be again. So lets see if this will lead us to where we want to be....
Some of this goes against the grain of some other trading strategies, but we are not trading other strategies, we are trading this one, and there is reasoning behind it and the indicators.
Attached Image (click to enlarge)
Attached File(s)