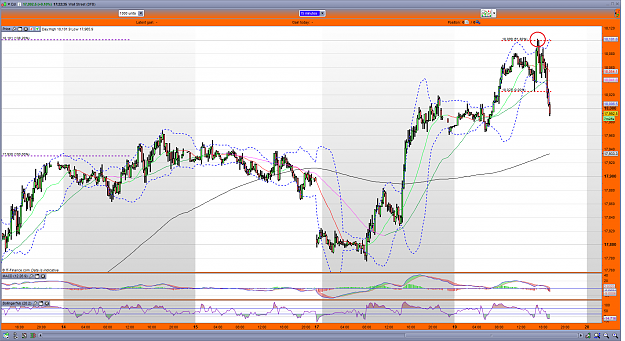
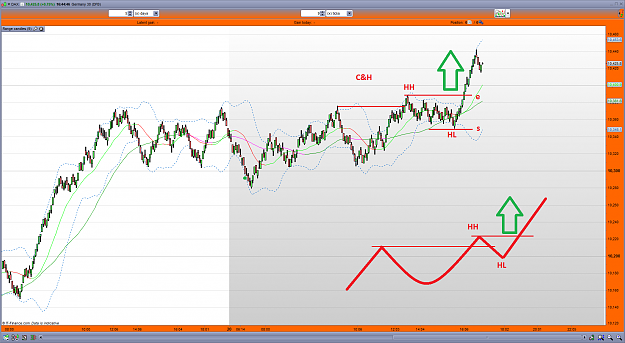
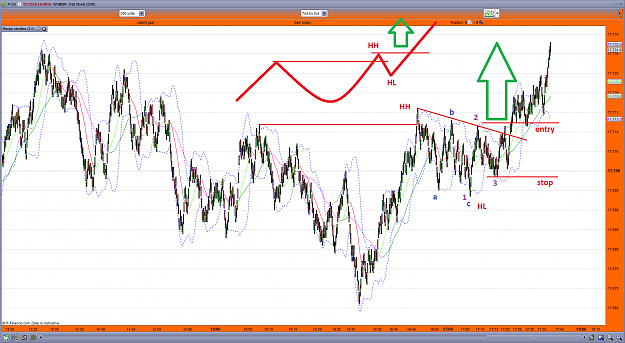
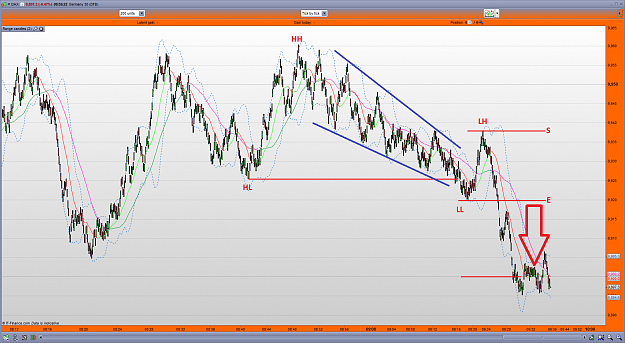
Can't resist just a couple of Dow charts. Firstly on the 2hr;
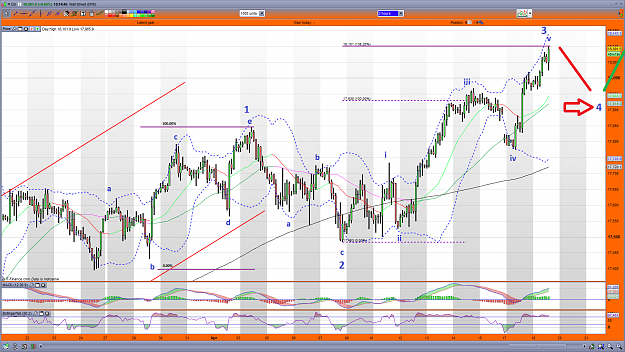
The previous 5w expanding diagonal being wave 1, now wave 3 fib extension 138.2% ends at 18,101 as per chart.
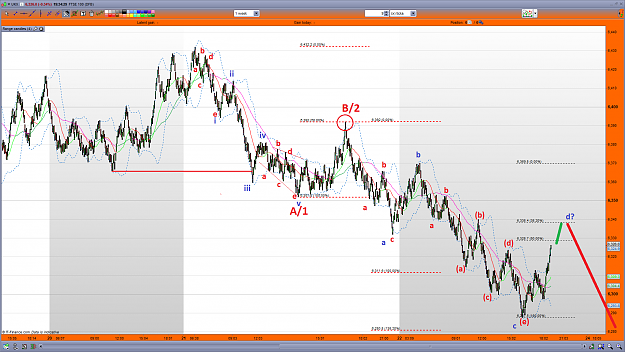
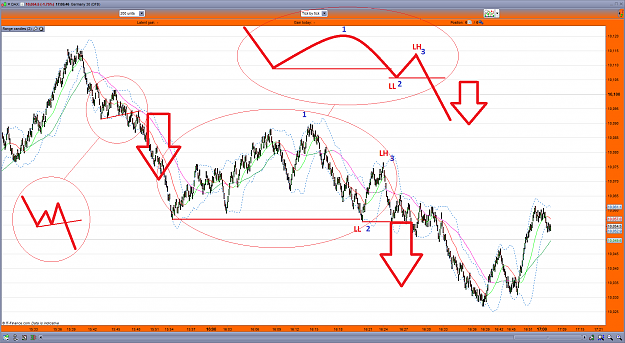
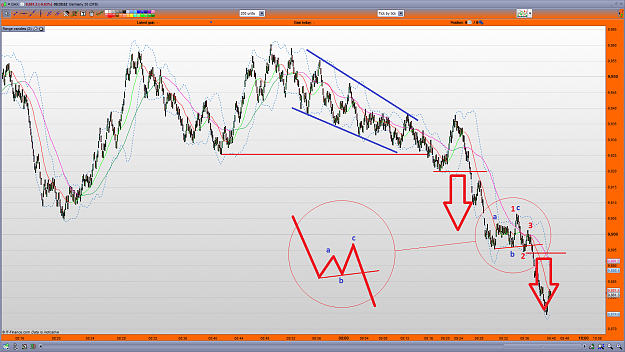
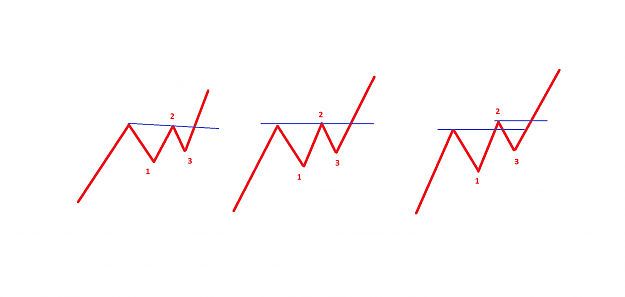
Looking at wave 2 and then subsequent subwaves i&ii of 3, it really wasn't easy to decipher. This is what i meant earlier about the need for all waves to be easily identifiable and why i prefer to look for pullbacks within trends on smaller timeframes as trading method...
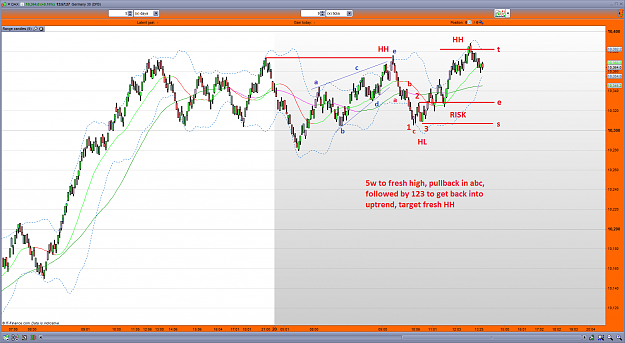
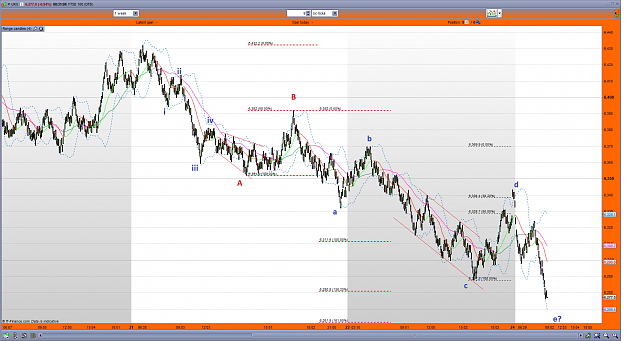
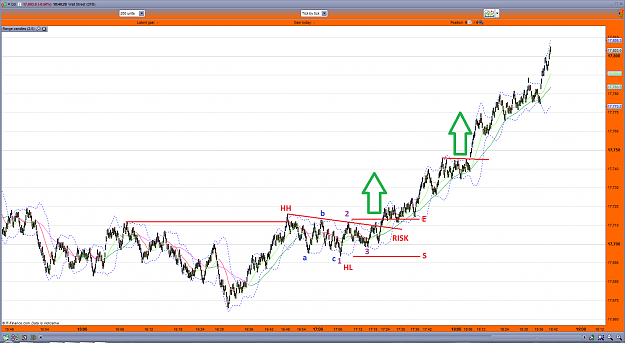
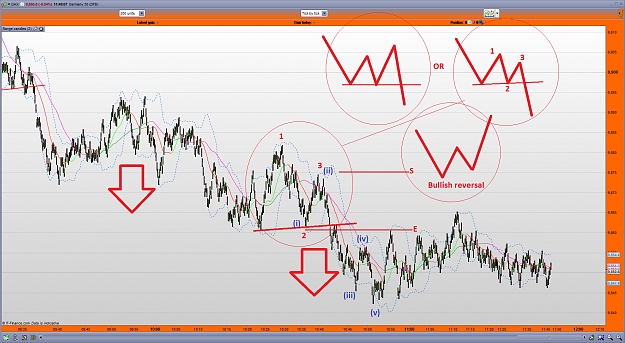
Dropping down to the 15min chart to break it down further, we can make a case for wave 3 being 5w and then even further the 5th subwave of the 5th (of the 3rd) 61.8% extension was also at 18,100 area;
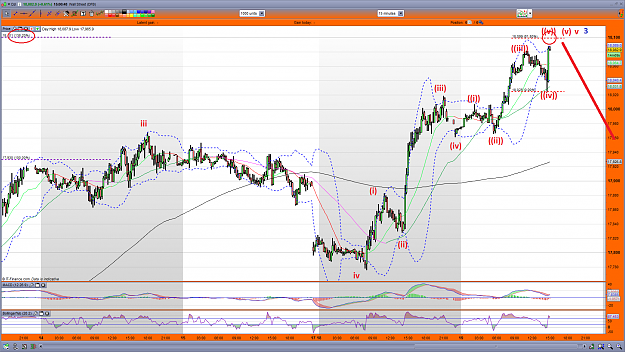
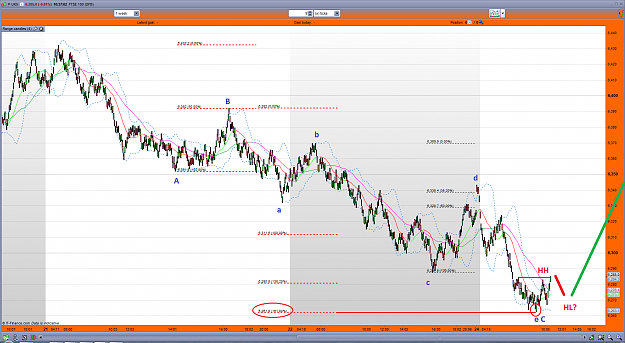
Has it topped for a while? Need to break the last sig HL @ 18,025 first.
Attached Image (click to enlarge)
The previous 5w expanding diagonal being wave 1, now wave 3 fib extension 138.2% ends at 18,101 as per chart.
Looking at wave 2 and then subsequent subwaves i&ii of 3, it really wasn't easy to decipher. This is what i meant earlier about the need for all waves to be easily identifiable and why i prefer to look for pullbacks within trends on smaller timeframes as trading method...
Dropping down to the 15min chart to break it down further, we can make a case for wave 3 being 5w and then even further the 5th subwave of the 5th (of the 3rd) 61.8% extension was also at 18,100 area;
Attached Image (click to enlarge)
Has it topped for a while? Need to break the last sig HL @ 18,025 first.
GoFundMe -stage-4-glioma-brain-cancer-fighter (link in my profile)