(sorry, this is a "How to?" question but I couldn't fit that into the title)
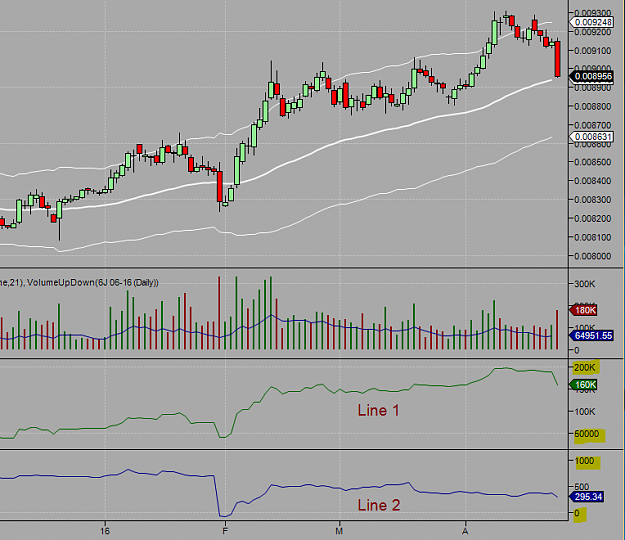
By slope I probably mean rate of change, as angle doesn't mean much on a trading graph (it depends on how big the chart window is!). But let's say I have two line graphs plotted in two sub-windows below the main price window (one graph per sub-window), and in the top graph the y-scale goes from a large negative number (e.g. -100,000) to a large positive number (e.g. +600,000), and in the bottom graph the y-scale goes from a small negative number (e.g. -20) to a small positive number (e.g. +200).
Because the y-scales are different, it's obvious that I need to normalise the scales somehow so that I can compare the slopes like for like. Is there a best-practice way of doing this? Some ideas I have are:
1. Use the difference between the min and max points on the graph as the range, and divide by that to get the rate of change.
Or:
2. Use an average of the last n bars (SMA? SMA/SD?), and divide by that to get the rate of change.
The problem with this is that as the line swings from positive to negative there will be a time when the average approaches zero, which will distort the calculation when you divide by it.
I'm doing this in C# but any code snippets in any language would be welcome if that's easier than typing the explanation in English!
Thanks very much.
You reap what you sow.