The only problem I see with your methodology is that you are trying fit patterns that were designed to be used for trading stocks. The stock market and the forex market are two different animals! I have worked for one of the largest commercial banks in the world and on any given day 80 to 85 percent of the currency transactions were for conducting business, not speculation, not fibo retracements, double tops, etc....... Remember that stocks are not used like currency. When a large corporation in the USA is buying machines made in Germany, they have...
Ignored
A very wise man has spoken! You are completely correct, but simple patterns like morning stars, head's and shoulder's etc appear and trigger similar moves in both markets.
Bulkowski is a stock trader, we allknow that. but a bunch of FX traders also trade naked.
Have you ever traded FX with naked charts? If so, what was your experience?
When trading: "Empty your mind, be formless. Shapeless, like water."
{quote} A very wise man has spoken! You are completely correct, but simple patterns like morning stars, head's and shoulder's etc appear and trigger similar moves in both markets. Bulkowski is a stock trader, we allknow that. but a bunch of FX traders also trade naked. Have you ever traded FX with naked charts? If so, what was your experience?
Ignored
I only indicator I use on my charts is a single ema, and that is just to get an idea of which side of the fence I want to be on. I also mainly trade off of the weekly charts, sometimes daily, sometimes monthly, but nothing lower than daily. I started trading in the futures markets and my mentor taught me to trade off the weekly charts, so that is where I feel the most comfortable. Also this allows me to do other things. I find that over analyzing things only makes for poor decisions. My best trades were the ones that I just let be. I know that if I was constantly monitoring them I would probably lose confidence in my original decisions and start second guessing myself. This can only lead to failure. I'm in the eastern time zone so I only look at charts on Friday's after 4:30 pm. I review what happened during the week, decide what I want to do for the upcoming week, and on Sunday after 5 pm when the market opens I put in my orders. That's it! I do nothing until the following Friday. That's how I trade. I'm pretty sure it's not for everyone, but it works for me. Also it's pretty stress free!!! Which is nice!
s {quote} I only indicator I use on my charts is a single ema, and that is just to get an idea of which side of the fence I want to be on. I also mainly trade off of the weekly charts, sometimes daily, sometimes monthly, but nothing lower than daily. I started trading in the futures markets and my mentor taught me to trade off the weekly charts, so that is where I feel the most comfortable. Also this allows me to do other things. I find that over analyzing things only makes for poor decisions. My best trades were the ones that I just let...
Ignored
Good stuff, I really like your style of trading! The longer I trade, the more turned off I get from lower TF charts. I'm starting to fall in love with daily charts. Strange, because only six months ago I would've laughed had someone stated I'd be trading daily charts today.
When trading: "Empty your mind, be formless. Shapeless, like water."
{quote} Good stuff, I really like your style of trading! The longer I trade, the more turned off I get from lower TF charts. I'm starting to fall in love with daily charts. Strange, because only six months ago I would've laughed had someone stated I'd be trading daily charts today.
Ignored
You have reached a milestone my friend, the biggest step in becoming a successful trader is realizing that patience is a part of maturing. Everybody wants to feel that they are part of some action that doesn't exist, if you want excitement with your money, then go to Vegas, if you want to make money trading, you have to observe the current conditions and then make a decision. I believe you are well on your way!
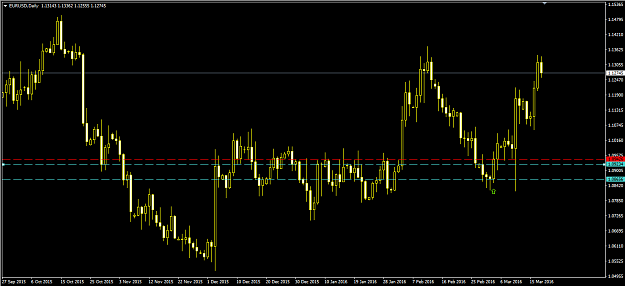
{quote} Nope, Three-Line Strike pattern! http://thepatternsite.com/ThreeLineStrikeBear.html According to the man,the Three Line Strike Pattern acts as a bullish reversal 84% of the time!!! If you go back about 20 candles you will see the same exact pattern, with the same exact result! Why mess around with indy's when allof the information you need is right in front of you??
Ignored
my bad - was only look'n @ red dash line .... i spotted that candle pattern at the pivot high but the body of the engulfing candle does not 'engulf' - the last candle [of 3 engulfed] is not black - may b u can point it out so we can learn this - thnx
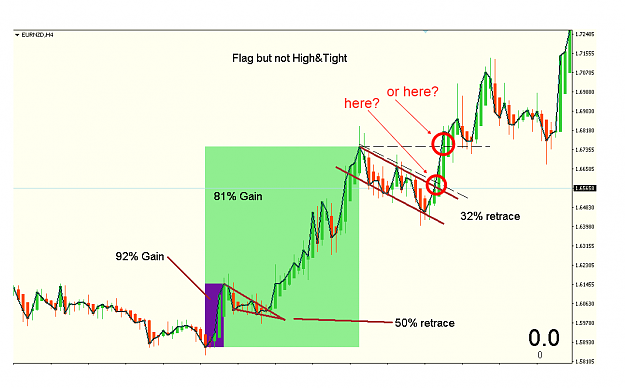
{quote} that is a bull flag - no doubt - but it aint high&tight [high means high vol & tight flag/wedge etc] .... the pole is a Elliot 5-wave [non of the impulse waves qualifies 4 high&tight] - so cause its a bull flag only .... entry is on the break of the upper channel of the flag - if u wanted 2 use limit orders on the bottom channel u may need a grid type entry ..... side notes: how the pole comes about is very important - in this EN H4 trade the entry is right on H4 res and the break of this would have been super cool trade ........
Ignored
Hi Griffin,
i want to ask about breakout flag, plase see the picture below
thanks alot man
We'll be looking at these later! {image} Here's a great book for those interested! My current bible! I'd love to not see standard trendlines, Zig-Zags etc but focus more on the great Bulkowski's discoveries! {image}
Ignored
I'm totally interested. I'll be checking out the book when I have a little extra time, that's for sure. I love trading flags, pennants and triangles.
{quote} I'm totally interested. I'll be checking out the book when I have a little extra time, that's for sure. I love trading flags, pennants and triangles.
Ignored
Yes! We are going to have some fun in here. i just hope for two things:
1) Nobody decides to add any sort of indy, etc
2) Trolls stay out
Enjoy your Sunday!
When trading: "Empty your mind, be formless. Shapeless, like water."
We'll be looking at these later! {image} Here's a great book for those interested! My current bible! I'd love to not see standard trendlines, Zig-Zags etc but focus more on the great Bulkowski's discoveries! {image}
Ignored
Hi, can you please post a link to the permission to post a copied version of this book.
{quote} Hi Griffin, i want to ask about breakout flag, plase see the picture below thanks alot man {image}
Ignored
[textbook ans] the lower entry 4 normal/usual bull flag .... the upper entry 4 high&tight ..... u can use the close [as i have] or the wicks ..... i only use wicks [try 2 ] for limit entries ......
there r problems wit quoting success % .... first u must follow the method/pattern/rule 2 the T - otherwise its meaningless .... another problem is how the study of the data was done - if u search for the historical pattern first and then apply ur SL/TP method dis is a major flaw [as any live trader will tell ya ] .... another problem is that the winning trades may have been bunched up over a short period compared 2 the total history period ... the list of problems are many....
{quote} Nope, Three-Line Strike pattern! http://thepatternsite.com/ThreeLineStrikeBear.html According to the man,the Three Line Strike Pattern acts as a bullish reversal 84% of the time!!! If you go back about 20 candles you will see the same exact pattern, with the same exact result! Why mess around with indy's when allof the information you need is right in front of you??
Ignored
Hello Shemski, I am a bit confused (sorry, I am not trying to be the awkward one in the classroom - I am genuinely interested and want to learn).
You are quoting a bullish reversal which is backed up by the link you attached but your example is a short trade.
I presume you're example is a bearish reversal using the 3 line strike but I can't find the formation in your chart.
Can you please highlight the formation on your chart? Thanks😊
{quote} Hello Shemski, I am a bit confused (sorry, I am not trying to be the awkward one in the classroom - I am genuinely interested and want to learn). You are quoting a bullish reversal which is backed up by the link you attached but your example is a short trade. I presume you're example is a bearish reversal using the 3 line strike but I can't find the formation in your chart. Can you please highlight the formation on your chart? Thanks😊
Ignored
From Bulkowski's site:
The bearish three-line strike candle pattern appears in the red circle on the daily scale. Price forms three black candles, each with lower closes, in a downward price trend. A tall white candle engulfs the price action of the prior three days. The candle acts as a bullish reversal when price breaks out upward, and closes above the top of the candle pattern.
{quote} From Bulkowski's site: The bearish three-line strike candle pattern appears in the red circle on the daily scale. Price forms three black candles, each with lower closes, in a downward price trend. A tall white candle engulfs the price action of the prior three days. The candle acts as a bullish reversal when price breaks out upward, and closes above the top of the candle pattern. http://thepatternsite.com/ThreeLineStrikeBear.html I hope this helped
Ignored
I understand the pattern and I see it clearly on Bulkowski's site. I don't see it in your example. Can you please highlight the candles you are referring to in the chart you posted? Thanks
{quote} I understand the pattern and I see it clearly on Bulkowski's site. I don't see it in your example. Can you please highlight the candles you are referring to in the chart you posted? Thanks
Ignored
Green arrow. I have understand that the entire price action of each candle should be engulfed, but the example that i showed you and the exact same patterns over the last 3 years have worked.
When trading: "Empty your mind, be formless. Shapeless, like water."
{quote} Green arrow. I have understand that the entire price action of each candle should be engulfed, but the example that i showed you and the exact same patterns over the last 3 years have worked.
Ignored
I am referring to your 1st example. There is no green arrow.I can see the pattern in your second example with the arrow.