Hello guys, just saw this thread and it looks interesting but I am extremely confused. I have 3 years of forex experience and I cannot understand the way james16 trades. I read a bunch of pages in this thread and I watched some of his videos and it is still really unclear to me. He uses bar chart that is very unpleasing to the eye. All bars are the same color and it's extremely hard to get the whole picture. The first page which is supposed to describe the method of trading has no explanation and all I see is a bunch of bar graphs with no clear explanation. Please could somebody briefly explan this method of trading with candlestick charts please?
{quote} Hi Mike i also think the market have been tough; also great trades you post can i ask you where was the initial SL in USD/NOK? Since the market was tough i take only 2 trades this month until now USD/MXN D1 BEOB at PPZ 18; even was at swing low, the BEOB engulf a lot of bar so i put a sell stop at 17.565 targeting the next PPZ 17.4 i moved my SL to BE quickly and i was stop out at BE {image} CHF/JPY 4H triple bottom , divergence, pinbar so a buy stop at 112.75 targeting the middle of the box 113.25, i won 0,5R in this {image} take care guys...
Ignored
Hey Flor
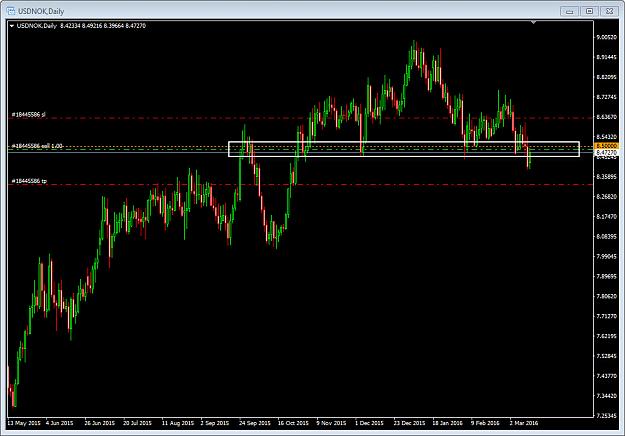
Yep the markets have been tough, was a good week but also holding a lot of stuff so I never count those chickens till they hatch. The stop loss was above the 2day BEOB. Price overshot a bit but I use half my risk in a deep retrace situation especially on a pair like that where things can do that. It was a rather large PPZ around that H&S pattern. I did move it up slightly before FOMC too just to watch out for spread widening but it didn't matter. Here was my original chart I posted so you can see
Hello guys, just saw this thread and it looks interesting but I am extremely confused. I have 3 years of forex experience and I cannot understand the way james16 trades. I read a bunch of pages in this thread and I watched some of his videos and it is still really unclear to me. He uses bar chart that is very unpleasing to the eye. All bars are the same color and it's extremely hard to get the whole picture. The first page which is supposed to describe the method of trading has no explanation and all I see is a bunch of bar graphs with no clear...
Ignored
Hey Trickshady
Welcome to the thread
What we do here is combine S/R, with price action analysis. So we look for very critical areas on the chart to find trades. Simple but also tricky because no two situations are perfectly similar.
Check out this beginner webinar on just the price bars we use, and some of our other videos may help clear things up. I still recommend reaading the first couple hundred pages if you can
I don't want to initiate unnecessary discussions so want be clear in first line itself that Im a commercial member and help the traders on profit sharing basis..my system is unconventional and has proven results. Only traders with reasonable account size will be considered for live testing..skype raghu1mata
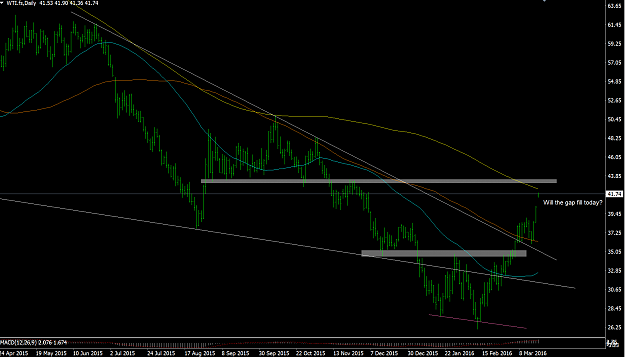
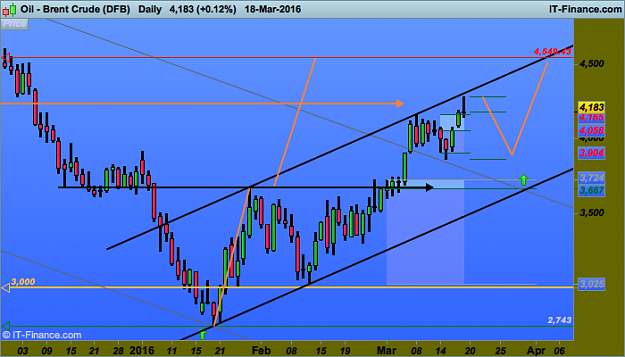
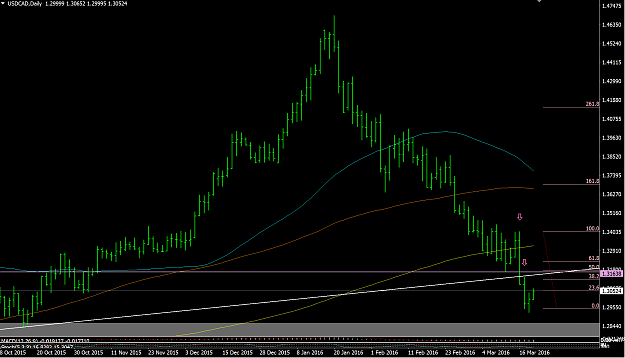
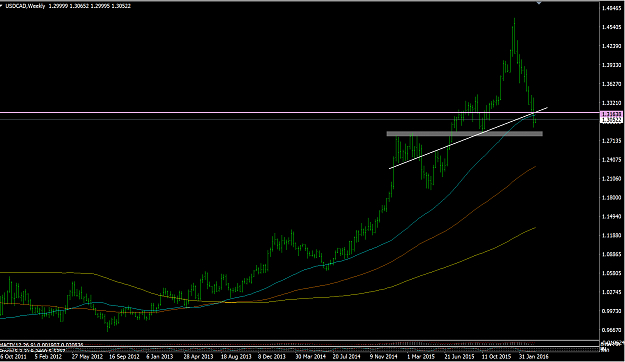
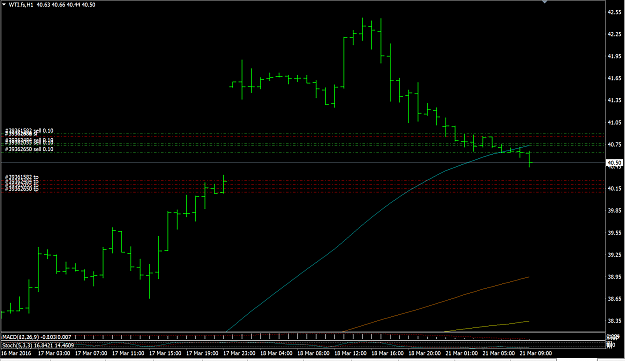
Ok, so have made some good profit off of USD/CAD these past weeks and i believe it has every chance to continue.
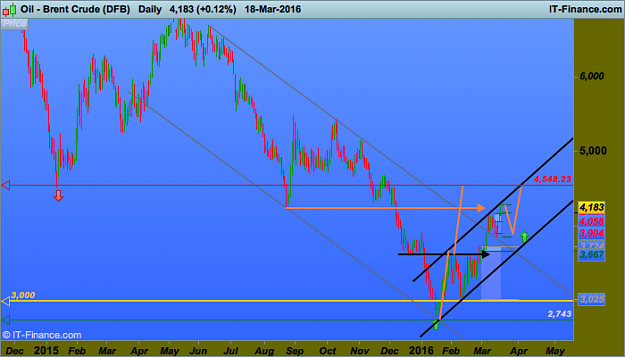
2-day BEOB, The retrace is currently underway and there's a fairly clear area to start taking shorts. The 38 and 50 Fibs lineup quite well with a solid TL (white) and solid resistance area (plum), so around the 1.312 -1.316 area. On the D1, the 50sma is well on the way to crossing the 100sma (bearish signal). The retrace should continue for a while whilst the "gap" on the Oil chart closes (Oil down, USD/CAD goes up almost always). Target is obviously the grey area, around 1.286 - 1.281. There's a few other bits of confluence as well coming together so now i have to put my patience hat on and wait. Any comments/thoughts???
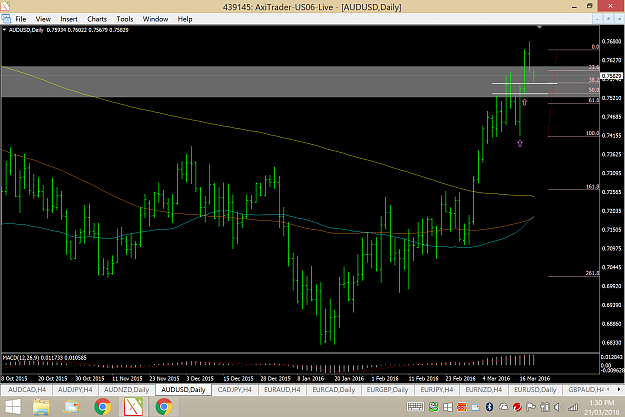
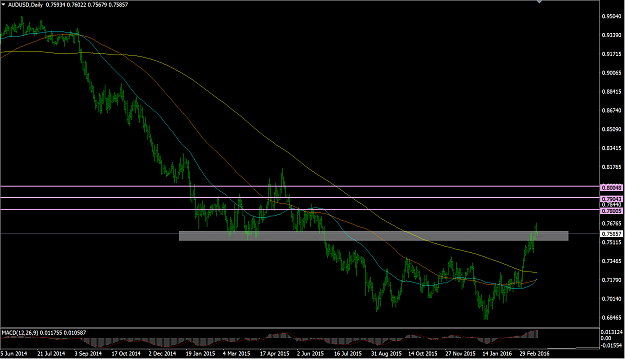
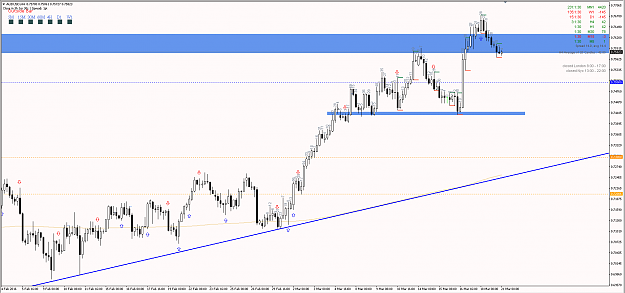
AUD/USD 2-day BUOB. This looks very bullish to me.
Price has retraced to the 38 Fib BUT at the risk of missing the retrace altogether, i will wait to see if it comes down to/near the 50 Fib area, which is where i think it will over the next 6 hours give or take a few. Price is not clear of the PPZ but it will be a small risk/SL if price can come down near that 50 Fib line. The 50sma is confidently crossing the 100sma and on its way to the 200sma (bullish signs). 1st target is 0.780, then 0.790, then the big 0.800! Comments/thoughts???
Ok, so have made some good profit off of USD/CAD these past weeks and i believe it has every chance to continue. 2-day BEOB, The retrace is currently underway and there's a fairly clear area to start taking shorts. The 38 and 50 Fibs lineup quite well with a solid TL (white) and solid resistance area (plum), so around the 1.312 -1.316 area. On the D1, the 50sma is well on the way to crossing the 100sma (bearish signal). The retrace should continue for a while whilst the "gap" on the Oil chart closes (Oil down, USD/CAD goes up almost always). Target...
Ignored
I agree with target - on my chart 1.2818 is where MA-365 stands, besides last week we consistently broke low from previous weeks, looks like a momentum for me. The one argument I don't agree is a retrace, I would not take short lower than 1.32 and would think about it between 1.32-1.3250 (most probably around 1.3230.
AUD/USD 2-day BUOB. This looks very bullish to me. Price has retraced to the 38 Fib BUT at the risk of missing the retrace altogether, i will wait to see if it comes down to/near the 50 Fib area, which is where i think it will over the next 6 hours give or take a few. Price is not clear of the PPZ but it will be a small risk/SL if price can come down near that 50 Fib line. The 50sma is confidently crossing the 100sma and on its way to the 200sma (bullish signs). 1st target is 0.780, then 0.790, then the big 0.800! Comments/thoughts??? {image} {image}...
Ignored
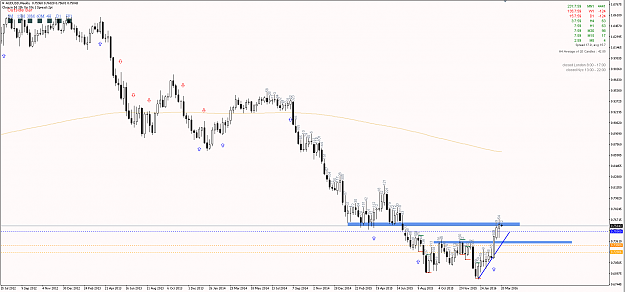
Looks promising, but for me it's too early. On weekly we failed to break PPZ.
I would wait for 0.7500 testing, because if it fails we have open way for testing much lower levels (retrace on weekly) to even 0.7250. Ultimate confirmation of deeper retrace would be breaking 0.7420 (PPZ on H4).
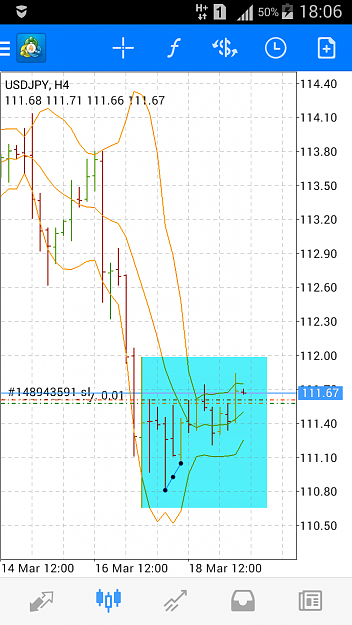
USDJPY H4. the price is in a cluster, two orders for TTE first closed +12 pips, the second order is transferred without loss. {image}
Ignored
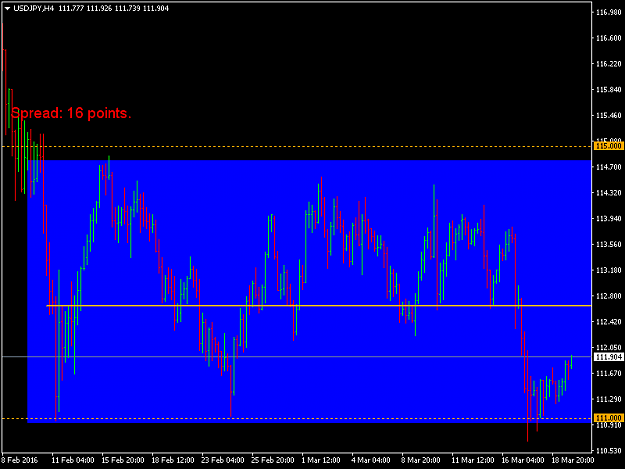
Hi v0lchen0k, IMO in usd/jpy we have a box so if you are long i think is the best to close around 112.7-113. Also what cluster did you see there because i don't see?