Disliked{quote} I'm still looking to put a method together, by observing on a demo account. When you have been offering suggestions, I've been looking to see if I can see what you see. I've yet to look at the TP though. I have started to watch the D.O. & L.O. for PA turning points to then watch for NLD triggers. Come this time of the week there are many such lines and I do not presume to know which will work (ie for a TP). However once PA has turned off one of them, I then look for the trigger. In terms of the NLD trigger bar, I have been watching for an...Ignored
As i said though and in my posts, for me im only using them for TP points. Generally i when watching the charts if i see a price reacting well in an area where i do not have a DO line drawn i will quickly look back to see why it is reacting in that way and can usually see some point of S/R. I may put the LO on my chart also just for further confluence after doing some more research. I also do not use every DO. I try just to use the ones that have some sort of confluence with an hourly or 4hr chart S/R. If i was to use every DO or even LO there would be lines almost every 10 pips or so.
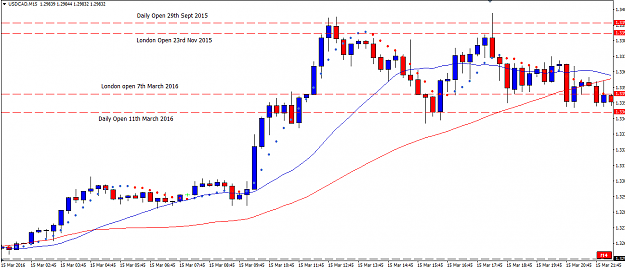
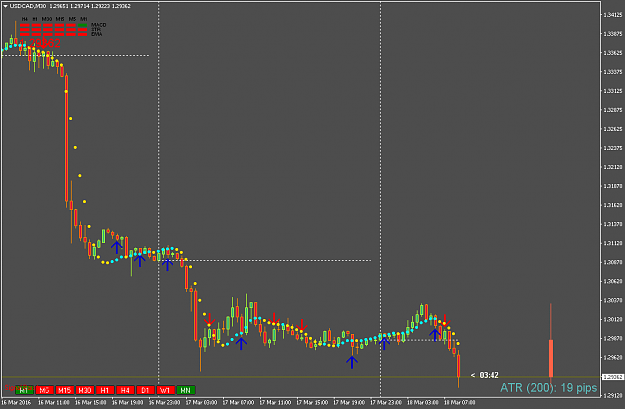
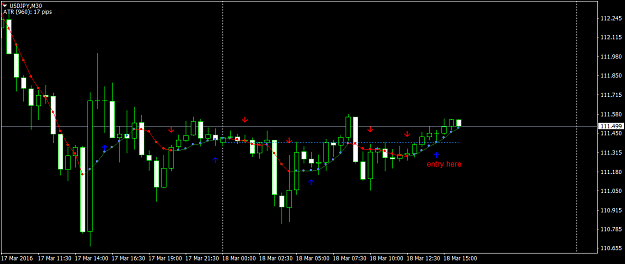
Just as in your chart image posted you can see that there was a strong support level on the previous DO but also the LO can be seen as resistance. Even though its just one day and doesn't prove anything it is still interesting to see. Perhaps considering both lines is beneficiary?
Pic: Red = LO, Black= DO
Attached Image (click to enlarge)