{quote} Hi aeseme, I was just thinking to myself - what is it that aeseme is incapable of adding to his already monster of a dashboard? I guess you have no limits once the concept is clear to you... you are a true "maestro" of the programming art indeed. Thanks a lot and I can't wait to to play with this dashboard ASAP.
Ignored
I expect to have it ready shortly.. need to do some final adjustments first...
Quote
Disliked
PS: Offline activities have really taken a heavy toll on my participation here on the thread and I really wish to get back ASAP and join the wonderful conversation of such a good spirited group of individuals as we have here in this thread and her fellow threads - Dashboard Trading and DashTZ.
Have you already read the #Post 1 of this thread yet?
{quote} I really like the idea of CL CS C+ C- I've been talking about it for a long time waiting for its implementation. So thank you aeseme for your openness to new ideas and incredible productivity.
Ignored
Thank you!!
Have you already read the #Post 1 of this thread yet?
Thanks aeseme , DBM is working properly , yesterday it started two trades after that no trade, what is the best criteria to initiate the trade manually? anybody please send me the link of latest DBM ? thanks
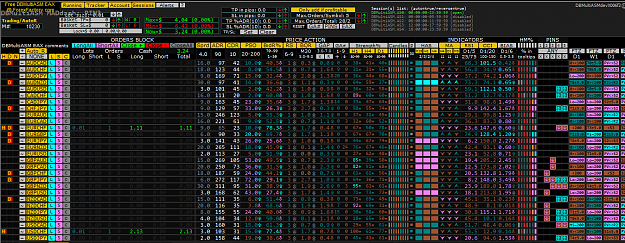
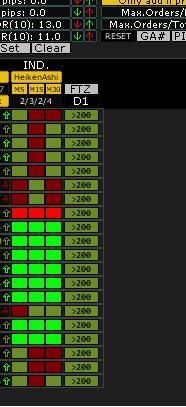
HI i uploaded screenshot of DBM, its not starting new trades, any recommended settings , thanks {image}
Ignored
Trades in auto-mode are opened on filters/triggers criteria matching. You might review your choices nor their levels.
There's not such thing as "recommended settings" (at least by the time being). If you want to follow some recommendations, you can find what users already shared by going across this thread posts or doing the same at Dashboard Trading ones.
Best thing would be if you manage to find something that worth being shared that is different of what's already been shared.
Have you already read the #Post 1 of this thread yet?
This thread is to allow me to have a better follow up of the development of a dashboard I'm working on and anything related to it. Before you ask, EAX comes from Expert Advisor eXtended/eXperimental/eXtreme... At this point I want to make some remarks, mainly, thanks to Gvc for his amazing work and contribution in his Dashboard Trading thread, where I found the main inspiration to start my own project. I want to also thank...
Ignored
Hi Aeseme, your dash is really great and usefull,almost complete but it would be nice if you could ad an option to move stops to psar like the attached
hey aeseme, your new version looks nice, some intresting features!
1. maybe i find a bug ior something n the current version. sometimes when i enabled the FTZ and disabled the PTZ then the FTZ dont work properly. it shows for exampe ">200". after i enabled PTZ again, FTZ shows the right values.
2. just want to kindly remind you this. i wonder that nobody suggest this befor. especiely ny open would be much more easier to handle.
.could you add to choose that the heatpmaps are independent of candle. i mean for example the h1 heatmap schould look back 1 hour, dont matter whats time it is. for example: at 9.11am the h1 heatmap look back to 8.11am (at 9.34am => 8.34 am and so on). i think it would be much more efficient way to filter out pullback-risky pairs. sorry for my bad english
Ignored
3. just an boring request for money management: maybe you could add that the dashboard stops trading when balance grown xx percent per day?
hey aeseme, your new version looks nice, some intresting features!
Ignored
Thank you!
Quote
Disliked
1. maybe i find a bug ior something n the current version. sometimes when i enabled the FTZ and disabled the PTZ then the FTZ dont work properly. it shows for exampe ">200". after i enabled PTZ again, FTZ shows the right values.
I'm not sure if I got what you mean here, ">200" is a valid display value and it means that the price has exceeded the upper FTZ that is Hi+100%(200%). Anyway, can you please elaborate a bit more to help me understand and better identify what's going on.
Quote
Disliked
2. just want to kindly remind you this. i wonder that nobody suggest this befor. especiely ny open would be much more easier to handle.
could you add to choose that the heatpmaps are independent of candle. i mean for example the h1 heatmap schould look back 1 hour, dont matter whats time it is. for example: at 9.11am the h1 heatmap look back to 8.11am (at 9.34am => 8.34 am and so on). i think it would be much more efficient way to filter out pullback-risky pairs
Ignored
Do you mean based on amount of time instead of candles period? Could you dig a bit more on its justification?
Quote
Disliked
3. just an boring request for money management: maybe you could add that the dashboard stops trading when balance grown xx percent per day? you are amazing!
This could be a good addition, I'll have it in mind, by the way, no ETA by now.
Have you already read the #Post 1 of this thread yet?
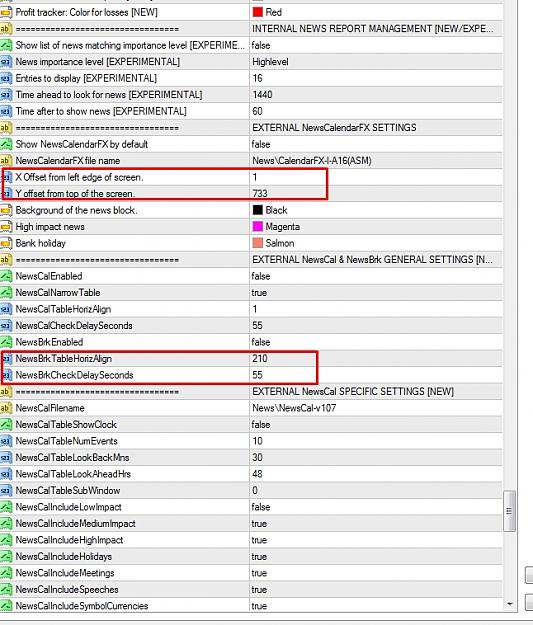
Hello thanks for the great work.. I have three questions, first of all I watched the video and read most of the pages but could not find the answers.. When I opened NewsBrk and NewsCal as news indicators on the chart loaded with DBMulti EA they come right in the middle of the screen separately and I could not move them to the right or left or bottom to make them look like as your settings displayed by attached images in your posts. Is there a way to arrange news sections properly displayed in the charts?
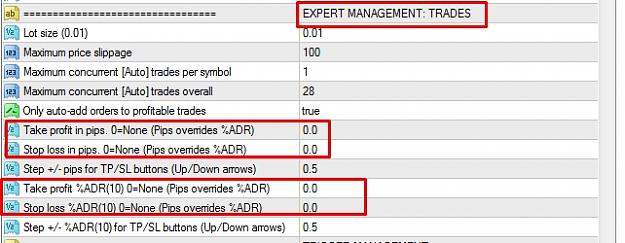
Second some other people also asked but when I activated Auto trade button on the EA, trade does not start although PIN signals are coming. Is there any other settings on the properties of EA that I should change to make auto trading active?
Lastly is there a stop loss or limit profit options in auto trading? Thanks for your time..
Hello thanks for the great work.. I have three questions, first of all I watched the video and read most of the pages but could not find the answers.. When I opened NewsBrk and NewsCal as news indicators on the chart loaded with DBMulti EA they come right in the middle of the screen separately and I could not move them to the right or left or bottom to make them look like as your settings displayed by attached images in your posts. Is there a way to arrange news sections properly displayed in the charts? Second some other people also asked but when...
Ignored
1. at the bottom of settings you have options to move news windows on the chart.also news features are activated only from inside the dash settings,dont need to load any separate news indicator on the chart.see news settings at the bottom of settings window.
2. when you have PINS activated check to see what other filters maybe are activated on your dash ,if only PINs activated then trades are open in acord with pins,if some other filter is activated then pins + that specific filter conditions must meet to open trades.
3. auto function is for autotrading,set as true or false to trade or not trade auto.
4. risk management is right into your dash settings,you must look again with some more attention.
open dash settings window ,make it a bit large and take every set line and read what means and identify it on the dash panel,in this way you will get used with every settings what means and what does.
I'm not sure if I got what you mean here, ">200" is a valid display value and it means that the price has exceeded the upper FTZ that is Hi+100%(200%). Anyway, can you please elaborate a bit more to help me understand and better identify what's going on.
Ignored
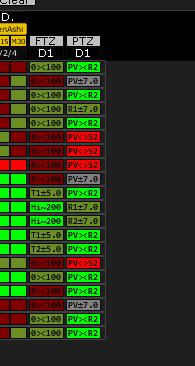
thank you for your reply and sorry for my bad explanation. i mean that every pair on dashboard shows the same (<200 or >200), i was wondering and checked some pairs and it was not correct, and after activation of ptz the ftz shows what i saw on the chart. i will show you next week some screenshots of this if you want, i unfortunately deactivated the ftz already becauce of this problem, so i cant show you now.
Do you mean based on amount of time instead of candles period? Could you dig a bit more on its justification?
Ignored
yes exactly this is what i mean. i have no idea of coding but when it is easier for you, you can modifier the PFO instead of heatmap. dont want to stress you. so any kind of posibility to choose "min", "max" and "amount of time" would be great. i am not sure what "Could you dig a bit more on its justification?" mean, google translater show me some useless stuff. but i guess you ask for more explanation? the meaning of my suggestion is, that often befor london or ny open the markets startet already a big move. and few minutes after lo or ny open comes the damn pullback. thats why i want to filter it out and use only the fresh new moves at session open. on lo open it is possible to compensate it with the h4 heatmap, but ny open? no chance because there begins a new h4 candle. thank you aeseme
{quote}Hi Aeseme, your dash is really great and usefull,almost complete but it would be nice if you could ad an option to move stops to psar like the attached{file} ea
Ignored
Interesting, I might consider something like that but no promises yet.
Have you already read the #Post 1 of this thread yet?
{quote} thank you for your reply and sorry for my bad explanation. i mean that every pair on dashboard shows the same (<200 or >200), i was wondering and checked some pairs and it was not correct, and after activation of ptz the ftz shows what i saw on the chart. i will show you next week some screenshots of this if you want, i unfortunately deactivated the ftz already becauce of this problem, so i cant show you now.
Ignored
Now I got what you mean, and it's really odd. I haven't seen something similar here but it doesn't mean it cannot happen to others. It will wait your additional input on this to help on identify what the issue could be.
Quote
Disliked
{quote} yes exactly this is what i mean. i have no idea of coding but when it is easier for you, you can modifier the PFO instead of heatmap. dont want to stress you. so any kind of posibility to choose "min", "max" and "amount of time" would be great. i am not sure what "Could you dig a bit more on its justification?" mean, google translater show me some useless stuff. but i guess you ask for more explanation?
Yeah, that was about more explanation about it real usefulness
Quote
Disliked
the meaning of my suggestion is, that often befor london or ny open the markets startet already a big move. and few minutes after lo or ny open comes the damn pullback. thats why i want to filter it out and use only the fresh new moves at session open. on lo open it is possible to compensate it with the h4 heatmap, but ny open? no chance because there begins a new h4 candle. thank you aeseme
Thank you for the clarification, I'll have that in mind but with no promises on ETA.
Have you already read the #Post 1 of this thread yet?
Good morning everyone,
I had an idea for the use of DbMultiASM , let me know what you think, it can also be a new approach to programming. I will try to explain with an example (I speak of DbMultiASM but can be applied to all dashes):
We typically try a profitable set , activating and deactivating certain indicators, I think of a different approach, we assume that the DbMultiASM has only 5 indicators for facilitating the explanation, those are RS, PSO, GAP, RSI and CCI we would normally use such indicators to decide weather or not enter in position, however I thought what if you could give to every indicator a certain value expressed in percentage (based on the importance of each of them) and then based on the sum of these percentages to proceed at the entrance (or exit) in or out of the market.
Let's assume for convenience that each of the 5 indicators have a value of 20% (20% of the signal) so if for example I’ RS I , GAP, and PSO I will have 20 + 20 + 20 = 60% for long signals , then maybe the next time I'll have that PSO RSI and CCI for short, same thing, 60% of the signal .... essentially give an absolute value of importance to each indicator, as a percentage...
For example, if the RS worth 50 % of the total ( because it is an important indicator ) while the strengh is worth 20% because it is less important .... because each indicator may be more more or less important than others, then the sum of this values will give me or not the signal t enter on the market.
I do not know you but to me it seemed like a good idea, maybe not simple to program but I think conceptually it's good.
{quote} Adding all the lagging indicators you would end up with super lagging monster. At best, dashboard should just be a filtering tool to use to trade.
Now I got what you mean, and it's really odd. I haven't seen something similar here but it doesn't mean it cannot happen to others. It will wait your additional input on this to help on identify what the issue could be.
Ignored
hey aseme, got a example, made this some seconds ago. as you can see, the ftz need ptz
This thread is to allow me to have a better follow up of the development of a dashboard I'm working on and anything related to it. Before you ask, EAX comes from Expert Advisor eXtended/eXperimental/eXtreme... At this point I want to make some remarks, mainly, thanks to Gvc for his amazing work and contribution in his Dashboard Trading thread, where I found the main inspiration to start my own project. I want to also thank...
Ignored
Could you tell me why i get the error
2016.03.01 20:20:27.896 cannot open file 'C:\Users\Gianni\AppData\Roaming\MetaQuotes\Terminal\9ACB2E2CE0389240C909714389C79575\MQL4\indicators\PINS\DBMultiASM_Bias_PIN_v1.0.ex4' [3]