Disliked{quote} Bill, Can you explain these trades to me please? Many Thanks BernadettaIgnored
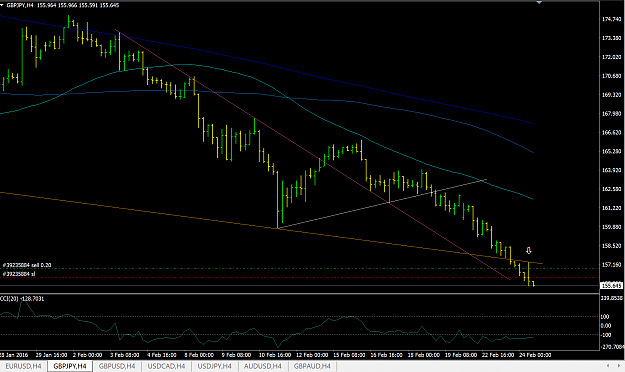
They're simple BO (breakout) trades. PA (price action) moving out of the support/resistance/trendline boundaries, confirmed by looking at lower timeframes that it was "unlikely" a false breakout. Also with the trend!
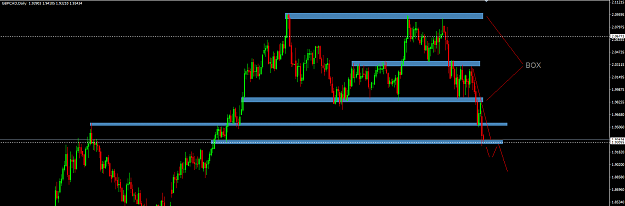
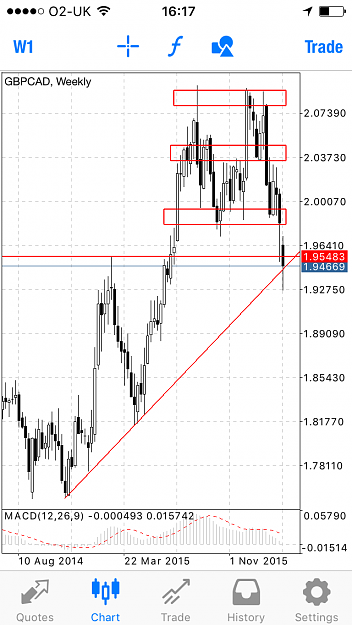
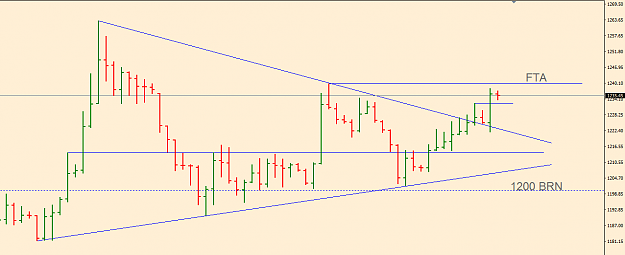
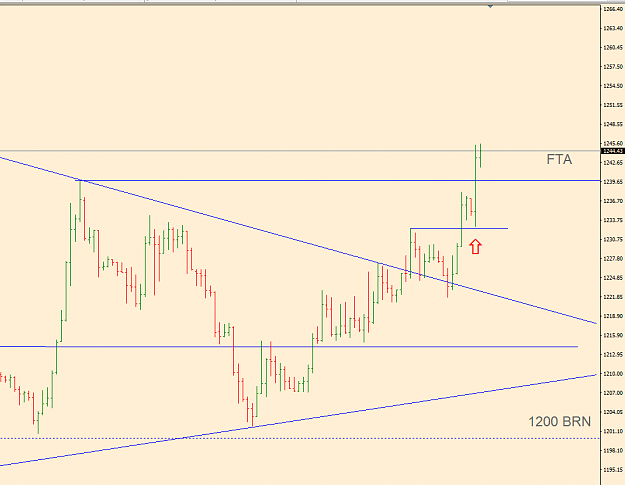
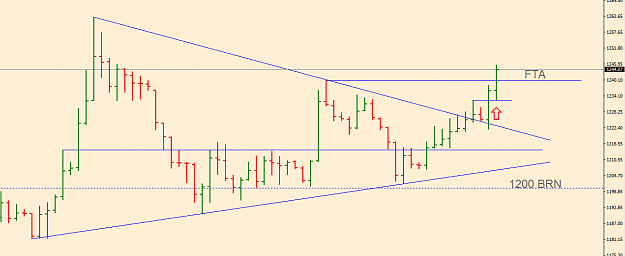
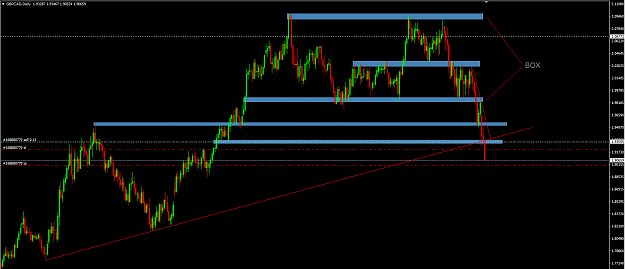
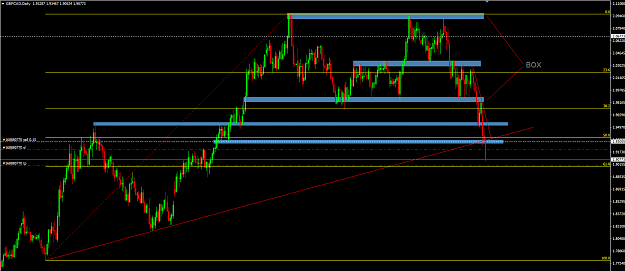
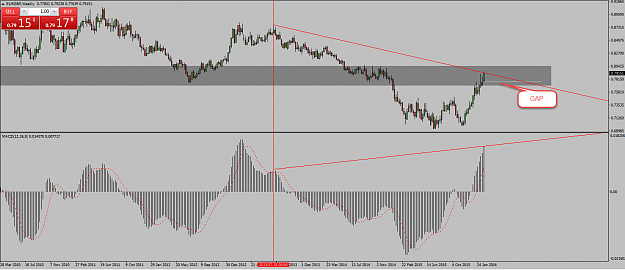
So the two trades you referred to were similar to the two below - price gets to support/resistance/ppz and i let the market tell me where price is "likely" to go when it hits that wall. Bust through or be turned away. In other words, "go with the flow" because it's certainly easier to sail with the wind rather than into it.
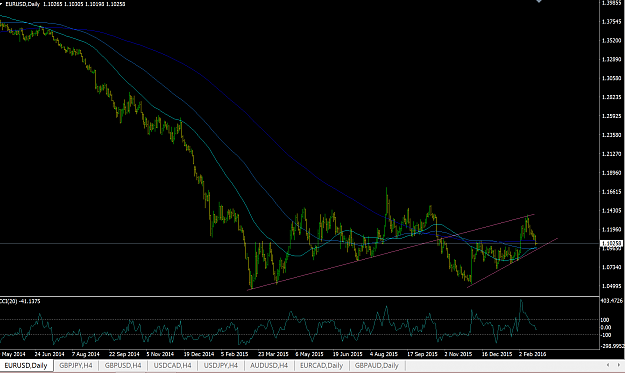
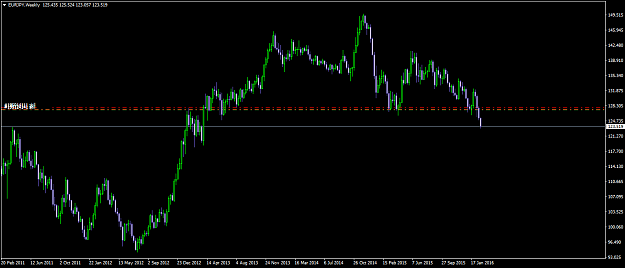
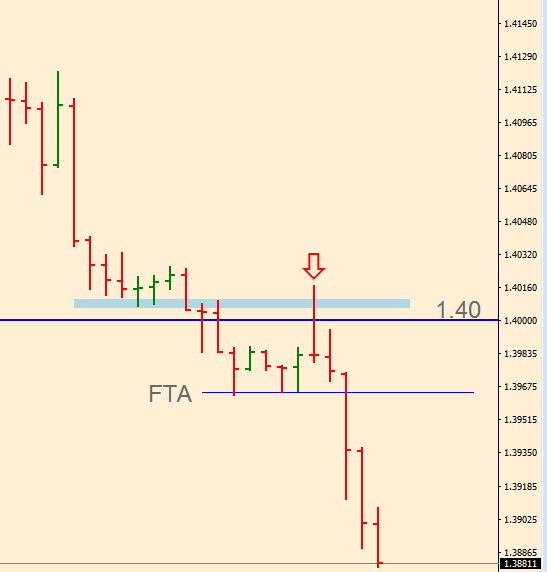
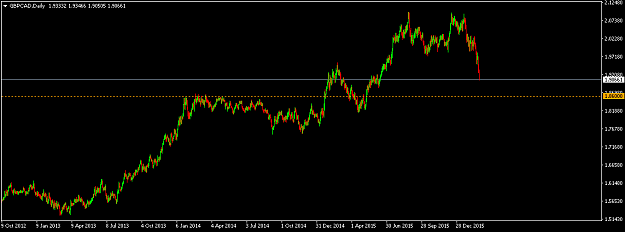
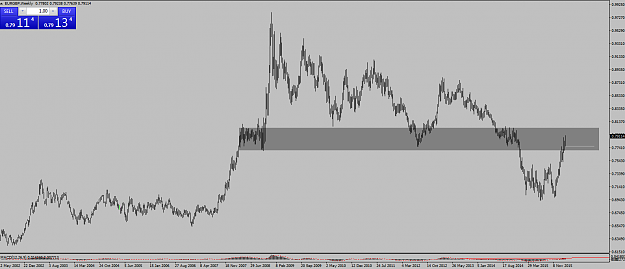
The EUR/USD chart below is one i'm watching closely for either a BO south of the support or a bounce off of the support northward. I'm hoping south as i think it would be a stronger move but either way there are pips to be made. PA will lead the way.
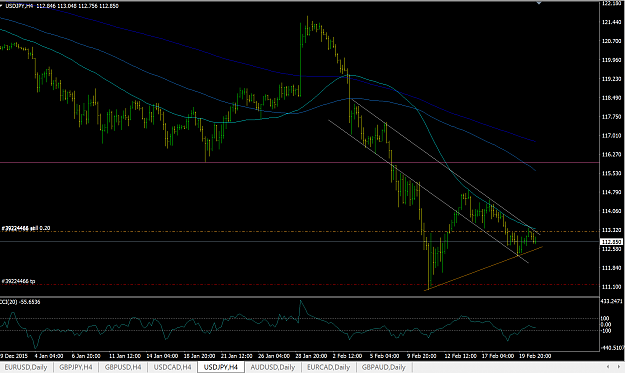
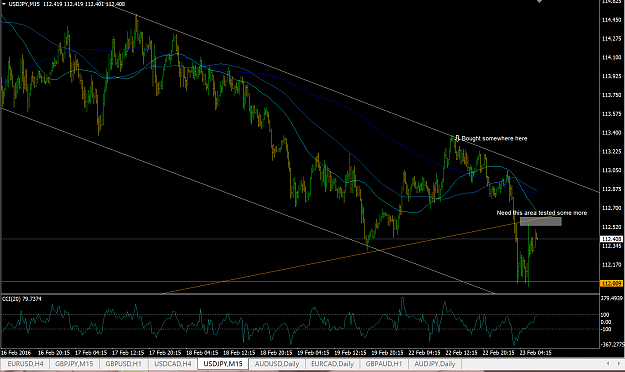
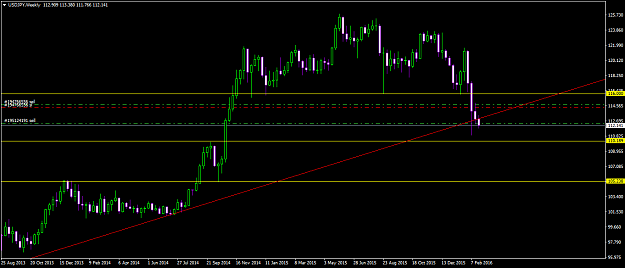
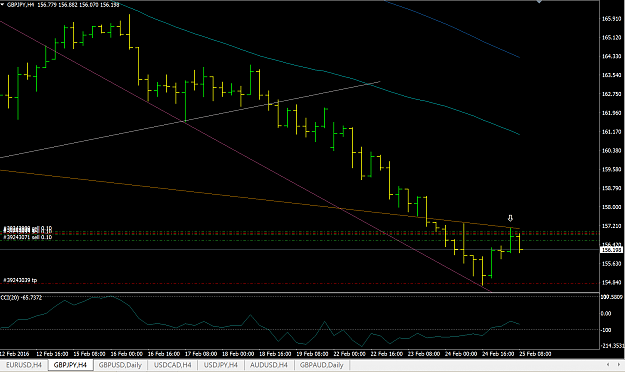
The USD/JPY chart below is a trade i'm in that, as per the scenario above, was either going to BO north or bounce off of the resistance south. It went south and that was my cue to get in. There is support at the orange line but as this pair is relatively benign i have already moved to BE in case there is a substantial bounce north whilst my back is turned, during the Asian session. If it gets to the orange support, i will then be watching veeeery carefully to see if there is a BO further south because then i will addin (be short again)
Hope this makes sense.
Bill
Attached Image(s) (click to enlarge)