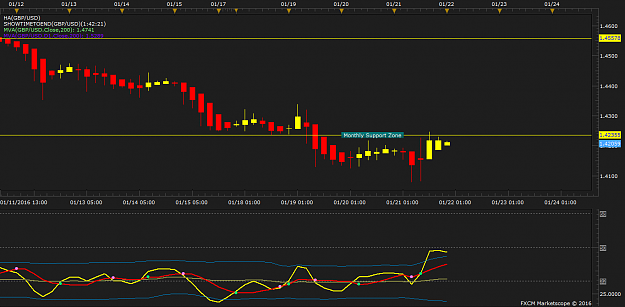
Disliked{quote} good trade sir, you make it look like simple and easy , i like it may i know why you plot stoch on ur chart? and how do you avoid this fake signal?(blue line) {image}Ignored
Please read through the start of the thread and you'll find the answer to your questions there.
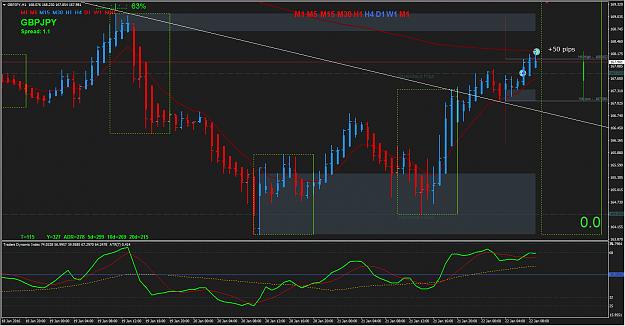
Disliked{quote} Well done Dimi , congrats, simple stuff works always TMS traders, when I say simple its after spending 100s of hours learning TMS only then it becomes simple I took EA short , and build postions during the session , +300 pips E/CAD short +100 pips EU short +90 pips GJ short +50 pips Posting only EA but other trades where almost identical {image}Ignored
Btw I always love seeing your trading charts mate. So much to learn from your posts!
Disliked{quote} good trade sir, you make it look like simple and easy , i like it may i know why you plot stoch on ur chart? and how do you avoid this fake signal?(blue line) {image}Ignored
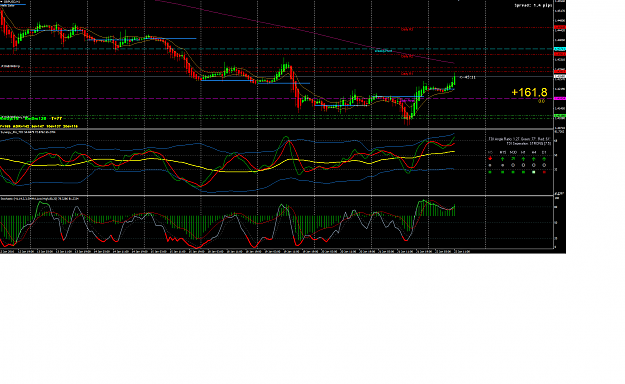
Traders, the reason I post the GIFS of my live trades is to help you (especially the newer guys) identify the entries and show proof that TMS actually works. The key is to stop adding other indicators to it. Just study the thread, stick to the old Big E method and burn those TDI entry examples into your memory so you can recognize them whenever they appear.
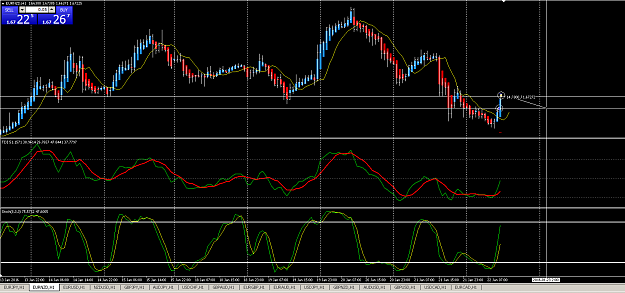
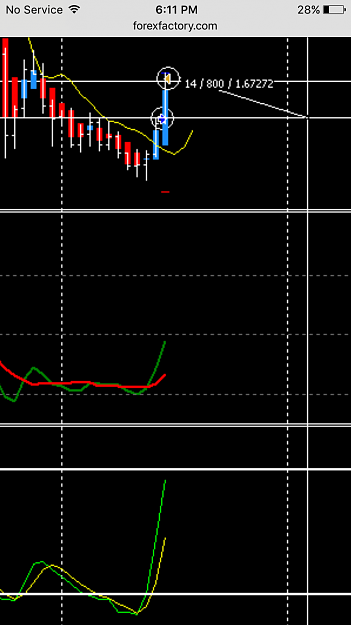
Here's another example of a small +25 pip trade I took towards the end of the New York session today.
As you can see the TDI is on a steep angle but sort of "leaning". Don't be discouraged by this, take the trade as they still produce good gains.
(Example below is an animated GIF if you click on the pic).
Attached Image (click to enlarge)
1