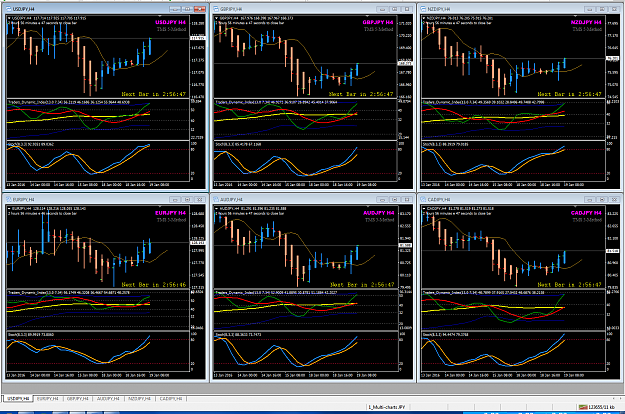
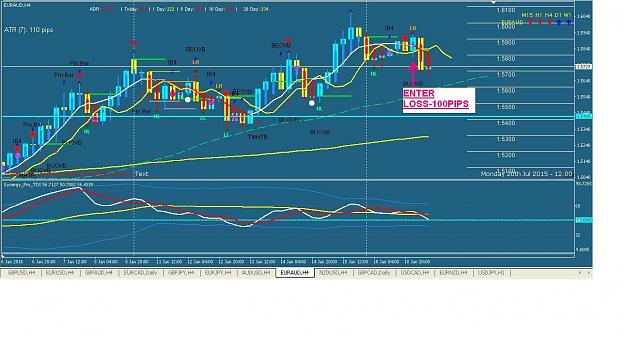
Disliked{quote} HI Emmanuel Im trying to understand why you marked this charts with a X or with check mark. Please take a look at my reasoning. I am right? Thank you very much EUR/USD you marked it with an X because the TDI was horizontal, it is so? AUD/USD tdi is Up, the APB down USDCHF TDI is up, but the green line horizontal, es it the fourth bar GBPUSD TDI up, APB down NSZUSD TDI is up, but the green line in getting down and it is the fifth candle USDCAD TDI is down but the candle are above the 10ema USDJPY TDI is up, it is the second bar, then it is...Ignored
First,
Cross-out 'X' means Not Good or No Go.
Check-mark '√' means Good, or Good to Go.
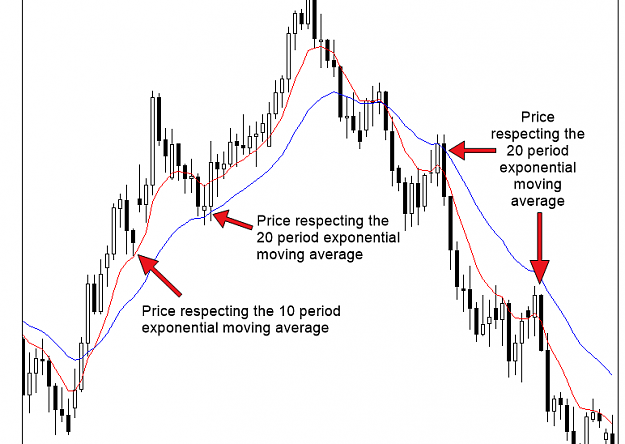
That chart template is basic 5-Method with the APB, TDI set to default and 5EMA set to Close Price, Shift +3 (not 10EMA)
There is a different in how the 5EMA use different from the 10EMA. In the 5-Method, the 5EMA is to see the general direction.
PA above the 5EMA is to Buy
PA below the 5EMA is to Sell
The 10EMA is use as dynamic support or resistance. We see this same 10EMA on H4, D1 and W1 charts.
On the H4 chart, the 50EMA is equivalent to the 10EMA on D1 chart and the 200EMA is equivalent to the 10EMA on the W1 chart.
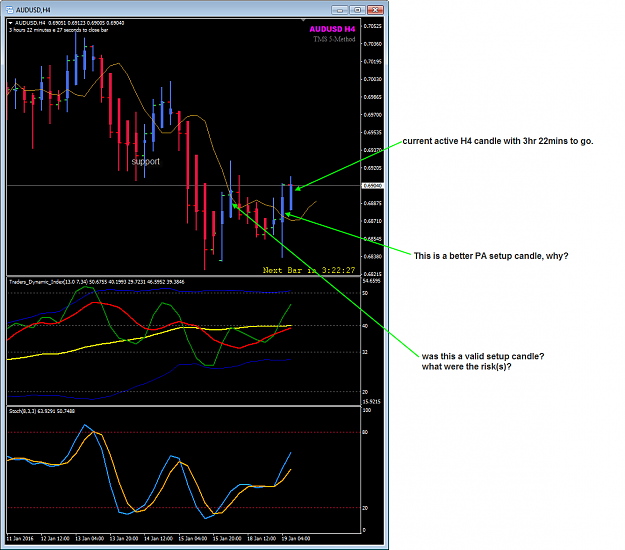
When we want to screen our charts for trade opportunities we must first setup our chart according to how we want to trade. The key components for trade Go/No-Go decision must be clear and not obstructed by other stuff. For example, if the candle run-time or time remaining time for the current candle is important to know, then have that in your template. You don't need all the stuff showing the multi-timeframe status on your trading charts. If you must and want to see what the higher timeframe is doing, simply switch chart TF or open another chart and apply the same template. This way you see the actual status of the APB and TDI. If you want to see Japanese candles, simply open another chart with Japanese candles and nothing else. Keep your charts simple and clutter free.
The way to learn and master the 5-Method is to read Post#261 and Post#647. Interpret what you understand these two posts and write down what see on your charts.
At the start of the trading week, you should already have done your trade plan and know what the trend is or your trade bias and you should already know what you will be looking out for.
The same, at the start of the day, you repeat and do the same.
Doing these with discipline, you will be mentally ready to trade and you will be able to make trade decision much quicker and easier. Your primary focus will then be in the execution of your trade plan and how to manage your trades.
Stay tuned for more....
Now I have to back to my own trading.
regards,
Honesty is a very expensive gift. You wont find it in cheap people.WBuffett