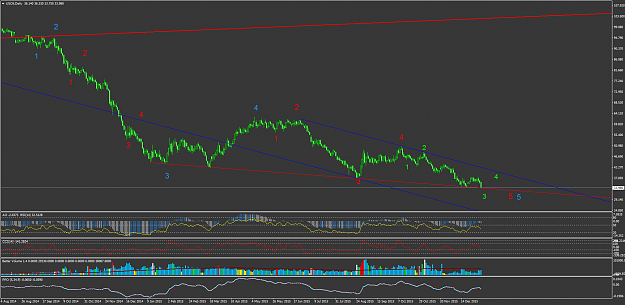
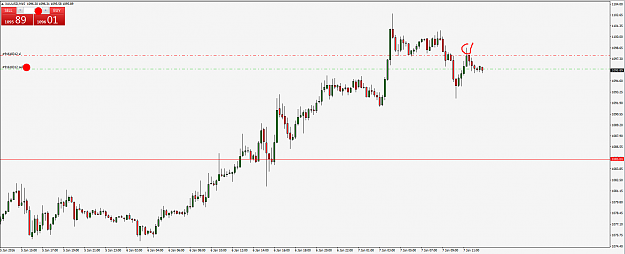
Funny speaking about this structure again, we didnt had it filled on Oil but it did went precisely as spoken on ECAD. It was more precisely bullish ,becouse it was clear descending wedge with strong LLs, wihch is stronger bullish (less of deeping leg) than shallow one.
Attached Image (click to enlarge)
Ill be looking to long it for another up wave, after retrace.
{quote} Funny speaking about this structure again, we didnt had it filled on Oil but it did went precisely as spoken on ECAD. It was more precisely bullish ,becouse it was clear descending wedge with strong LLs, wihch is stronger bullish (less of deeping leg) than shallow one. {image} Ill be looking to long it for another up wave, after retrace.
{quote} Oils are in manic phase...... soon the bears will burn their fingers am waiting and watching
Ignored
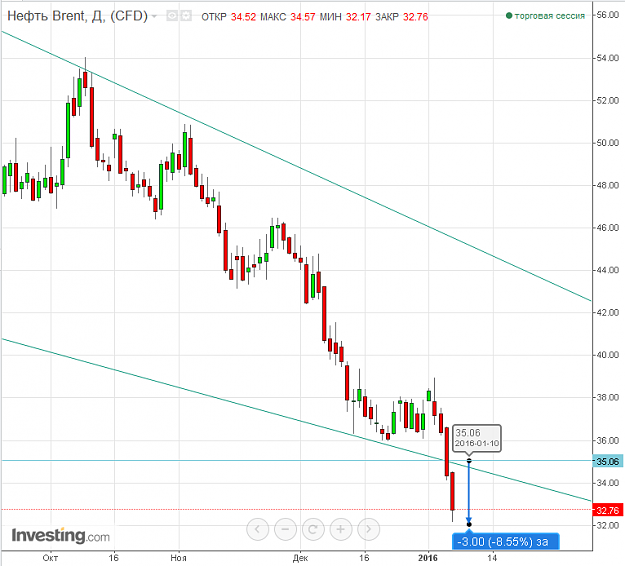
Mind that not all markets correct, even when bear/bull ratio gets in insane rates. As for bears it is common to expect that they will be squeezed (those very late ones) becouse they always get, we had one decent squeeze already 2 months ago, so such 10 bucks rallies can happen, but i would dare to bet that Oil will not pass above 60 for next years to come. Have already pending on Brent 54.5 atm will add also lower one somewhen latter.
Bought UZAR 15.467, still no move from ZAR/TRY CBs in regards to hike. Turkish CB did note that they will consider hikes if FED moves, but wierdly enough they cut the weekly depo rate instead of hiking it. The fact that there was no move in either of CBs makes good consideration that those two currencies, ZAR especially will likely hit large inflation in next 2 years if not hiperinflation. All EMs are trapped becouse they cant hike due to weak China/themselves, and FED precesly knows that.
Ignored
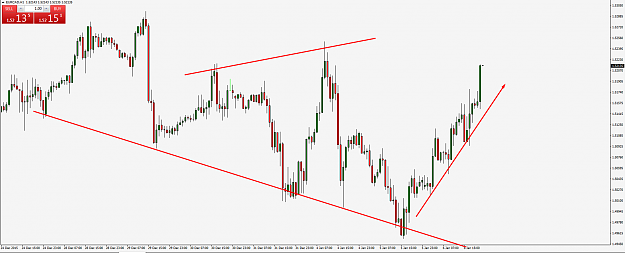
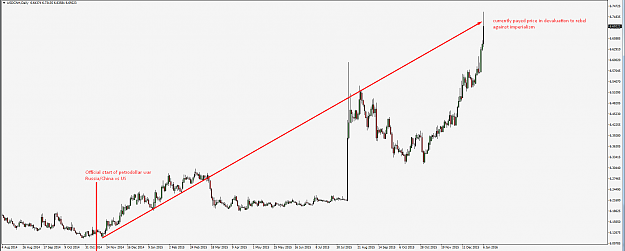
And there it goes along the plan. EMs 250+ pips above since this post.
That is the reason why i told my fellow Russian trader that i day trade with that shitstorm will hit EMs with Russia/China on flagship in 2014 November. There was no info in charts yet back that, and yet here we are.
Attached Image (click to enlarge)
Its all clear why China and Russia want their freedom from the imperial financial structure and in a way aswell political structure from the globalist empire, but the real question is what is their end gameplay. I am not in those basket of economists that they think they know better than leaders and army of their advisors on what will happen in future, i believe they completly realize that just not telling the public ahead, weater that is Obama, Putin or Xao. So what do those two countries their winning plan is that would be interesting to know. Petroyuan will be set in place this year, but it will damage Russia even more than it will US, so in short term no idea what they see from this. Pretty sure Putin knows this economic sanctions of EU are not going to end, and Russian goverment knows that Chinese demand will slow down, so really curious what do they have put in plan that would in the next few/several years at the end put those two countries on upper hand side. And perhaps will those 15k+ tones of gold in China actually play the role once inflation sets in?
{quote} Funny speaking about this structure again, we didnt had it filled on Oil but it did went precisely as spoken on ECAD. It was more precisely bullish ,becouse it was clear descending wedge with strong LLs, wihch is stronger bullish (less of deeping leg) than shallow one. {image} Ill be looking to long it for another up wave, after retrace.
Ignored
Interesting, nice catch!
Don't have an ego. Always question yourself and your ability.
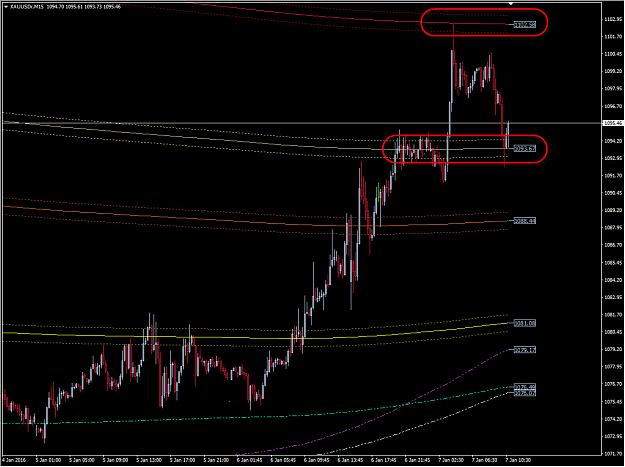
{quote} GOLD EW count weekly TF we are in a wave 5 ending diagonal scenario. All waves develop as ABC Inside of this red wave 5 we are in green wave 5 Inside green wave 5 we are either in the last moves down of wave A, or already in wave B up. Wave B up should ideally end in the 1100 to 1118 vicinity, before the last wave down concludes around roughly 1020-994 When we break below of 994, picture would get very bearish. In this case the green 4 may only be the green 2. But sentiment data do not support this view in my opinion. {image}
Ignored
was a very good call - now all eyes to 1100- 1118 for a change in direction towards the 1000 psych level and a bit below
{quote} thanks my friend In the bigger scheme I think, that we are in an ending diagonal situation. The 1191.x top marked the end of the wave 4. Since that top we have seen an impulse down. That would then be wave A of the ABC wave 5 The wave B of the wave 5 may reach to the 1102 to 1136 level (38,2 and 61,8 fib retracement). So far, the waves up inside of the whole ending diagonal have always retraced at least 50%. After that, I expect a last impulse down into the roughly 1020 area (sharp), or up to 995 (more kind of an ending diagonal...
{quote} And there it goes along the plan. EMs 250+ pips above since this post. That is the reason why i told my fellow Russian trader that i day trade with that shitstorm will hit EMs with Russia/China on flagship in 2014 November. There was no info in charts yet back that, and yet here we are. {image} Its all clear why China and Russia want their freedom from the imperial financial structure and in a way aswell political structure from the globalist empire, but the real question is what is their end gameplay. I am not in those basket of economists...
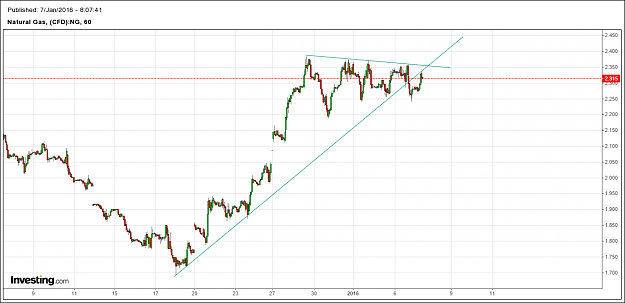
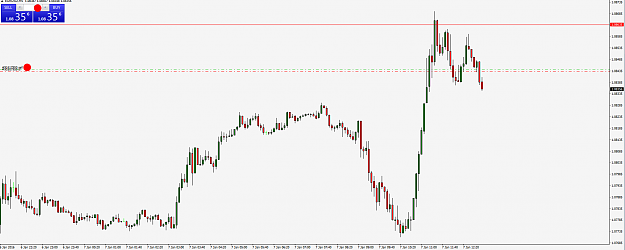
NG has held its grown so far during this oil drop, wondering what will happen next with these trendline, just a bit off to be a triangle 4th so just playing lines on it for now
Attached Image (click to enlarge)
Don't have an ego. Always question yourself and your ability.
{quote} Guys, I want you to be right all, and we can not now say how the current week is about to be closed, but the things I am looking at are not good enough. Best D.P. {image}
{quote} its not as u said it was a daily chart,to see and have a very clear view but,u have the short time frames ,as u know from 5 min going bigger as u wish this is 5 min chart: {image} with respect
WTI still hanging around, but Brent is giving in. In aprox 2 months IAEA is going to implement nuclear deal for Iran, which means we are gona get additional 1+ milion barrels of Oil on markets. With that supply we can see Brent on 20 easily.