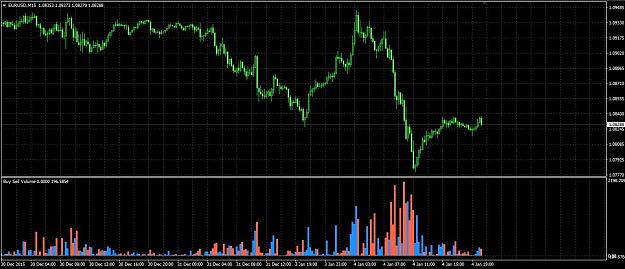
I soon realized that the actual price chart - irrelevant of timeframe - was in fact an indicator. In other words, the price movement of eur/usd is an indicator.
eur/usd = indicator between two currencies (irrelevant of timeframe/candlesticks).
Ironically, you can have strength in euro and strength in us dollar, yet, the eur/usd 'indicator' (price chart) can be up, down, sideways...

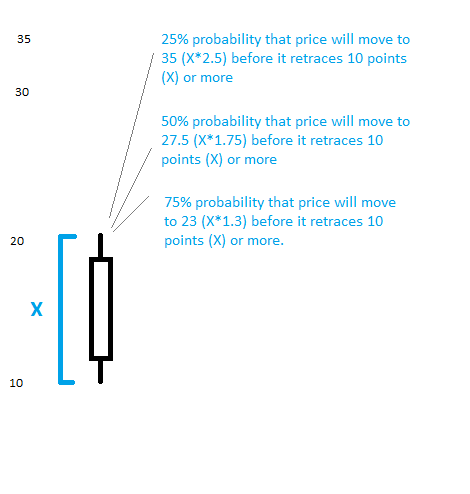
The outcome of THIS is what will determine the inmediate size, color and fatness of your candlesticks.
Candlesticks provide a means to (statistically) analyze range expansion and contraction within a (insert your trading choice) minute/hours/days period, which in turn allows you to build a probable(?) roadmap of potential(!) movement....but it will all go to shit (of course,...its a probability not a certainty isnt it?) the moment euro strength and us dollar strength change, and the best part is it might be another market all together that does this haha.
Happy Christmas to all!
eur/usd = indicator between two currencies (irrelevant of timeframe/candlesticks).
Ironically, you can have strength in euro and strength in us dollar, yet, the eur/usd 'indicator' (price chart) can be up, down, sideways...
The outcome of THIS is what will determine the inmediate size, color and fatness of your candlesticks.
Candlesticks provide a means to (statistically) analyze range expansion and contraction within a (insert your trading choice) minute/hours/days period, which in turn allows you to build a probable(?) roadmap of potential(!) movement....but it will all go to shit (of course,...its a probability not a certainty isnt it?) the moment euro strength and us dollar strength change, and the best part is it might be another market all together that does this haha.
Happy Christmas to all!
2