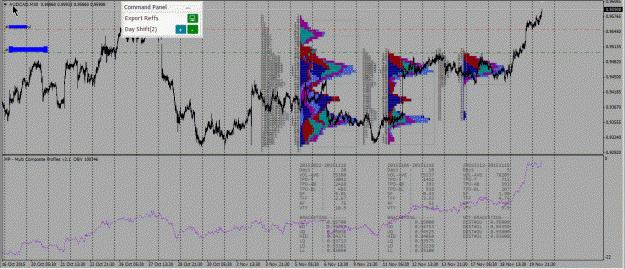
DislikedHi mzvega, my strategy yesterday was: 3 or/and 5 day bracket for breakouts and responsive buying/selling. For example 3 bracket breaks on LLBracket I go short, but the price comes back into bracket and takes my stopp loss on bracket LO. I go responsive long on bracket LO, but got stopped out again on bracket LL. Net flow was directionaly down, but no activity. I thought the news would bring enough activity for breakouts. But that was not what happening. It was more confusing price mov. stopping me out (range extension). So you are looking for what...Ignored
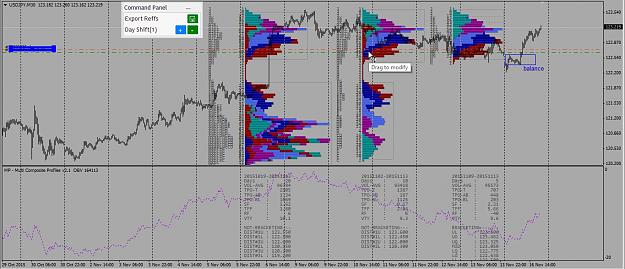
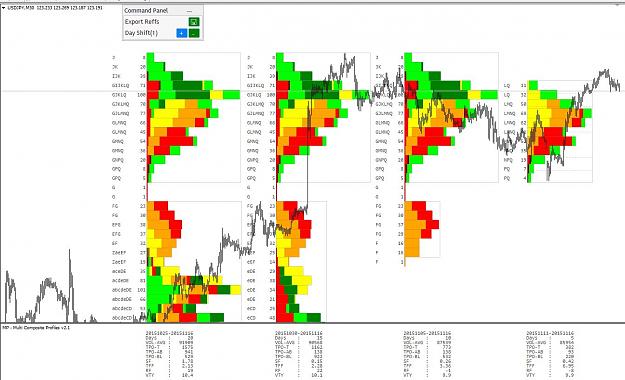
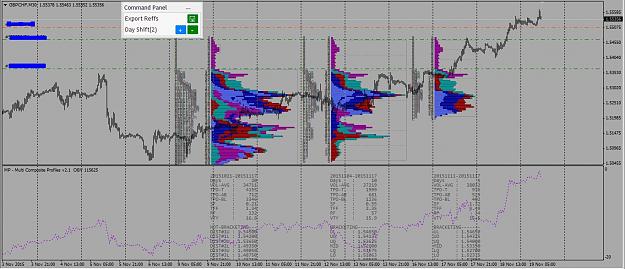
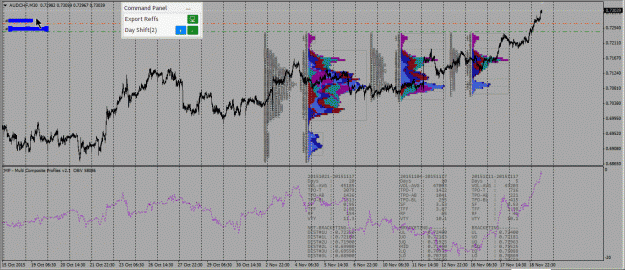
The Overlay Demand Curve displays the market condition. Markets can be either (1) balanced or bracketing, (2) testing the bracket for breakout, (3) trending, or (4) ending a trend. These four conditions comprise the market cycle.
Market Condition. Whether the market is balancing or trending (or in between), market condition gives one a sense of direction. This quantitizes one's day trading strategy. Market Condition is the base for all trading decisions. (as stated above 5 to 20 days, is the source of the market condition)
While breakout/trend trading is easiest to understand, many traders get started with intra-day or Responsive trading. The specific risk per trade is lower but so is the Potential. And trading costs become much higher. Responsive trading is much more nuanced, the signals are less defined. We want you to take the easier road at first. Later on you will see material on Responsive trading. For example, see: Responsive Trade.
The FOM data we discussed how to use it for "proof of principle" of your trading strategy. We did it for breakouts. Test your strategy for "proof of principle" for responsive trades on a 3day. (Cisco did the research for us)
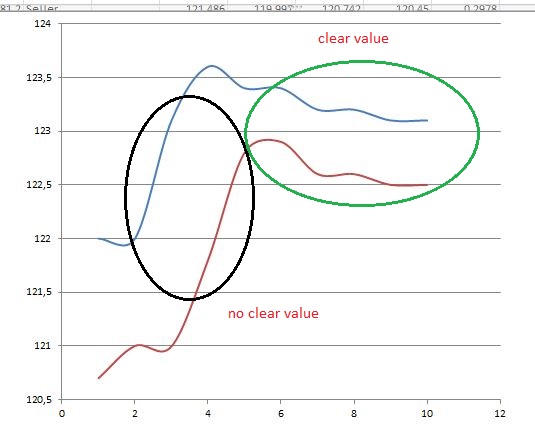
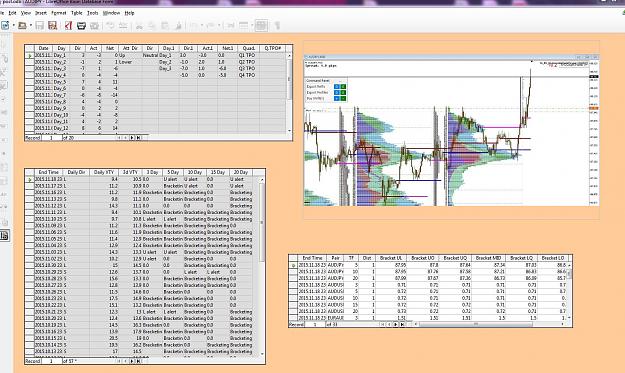
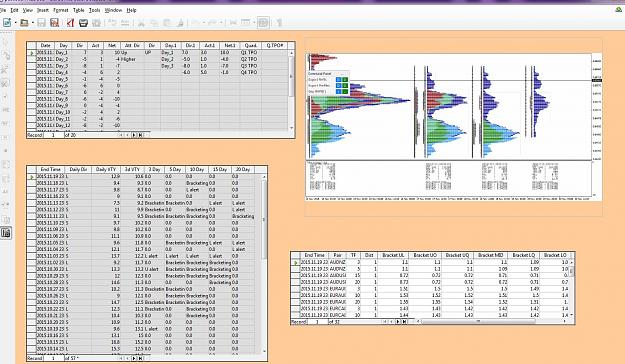
In all the material the 5day determines condition. One reason the 3day is not listed in the bracket screen or used in their database for potential opportunities is because the distance between the UL-UO is usually narrower than the VTY. That means both your entry and your stop are placed within the volatility envelope. And if the 5day is used to determine condition, by trading the 3day your assuming that somehow the condition of the market has now changed. If the 5 hasnt changed, neither has the condition. The 3 day is not listed because risk per trade is lower but so is the Potential. So they dont even provide the information.
Being that we have the data available doesnt mean we should trade it. (we do have the option not to see it on the chart).
This is very difficult for me to answer. I keep things pretty much text book. I also dont post any info unless it can be supported by a published reference.
I have yet to find any reference that suggests we should be trading using the 3day. Only all potential trades start with a 5day bracket.
However, I cant say dont trade the 3day, But I have yet to find any material that thats supports doing so. If you follow the rules: If you keep your stop is outside the volatility envelope, because of the smaller 3day TF you wont find many opportunities where the distance UL-UO is greater than the vty.
The risk outweighs the potential. Another reason Cisco doesnt provide 3day brackets for potential trade opportunities.
There is nothing that says you cant, but if you do you should understand the risks associate with it.
If you were using Cisco data exclusively, you wouldnt be using the 3day to look for potential trades, the data is not provided) all potential trades start with a 5day bracket.
On occasion Evak and I do, we both understand the associated risk involved, but were using info about the 5day. The assumption is a change in the condition of the 5day, but strategically on occasion I use the structure of the 3day for early entry. My trade decisions & reasoning (responsive or initiative) is made based on the 5. If the data supports a high probability trade on the 5, I may enter earlier using the 3day if the data supports it..................
Markets are not efficient, rather they are effective - Jones