Dislikednot sure lolIve always gone by what it says on the crosshair tool on mt4, from where i entered to where i exited it was 280 so ive always just counted that as pips.
Ignored
The cross hair on MT4 will show 2 numbers as you move it up which is whole number and 10ths of whole number i.e. 19 is 1.9 pips the it goes to 20 which is 2.1 pips etc so when you get to 200 this is 20.0 pips etc so 280 reads 28.0 or 28 pips.Hope this helps.
Now to the stuff re Market Profile (MP).The main problem with MP is a practical one which is that though really useful it creates massive amounts of junk in the objects section which in turn gobbles up CPU which in turn slows the platform and screws a lot of memory.Decision for me , do not have it on the chart or as an indicator.
However,MP shows the extremes and the more general area in the middle very clearly.The extremes are the HH and LL for the day.
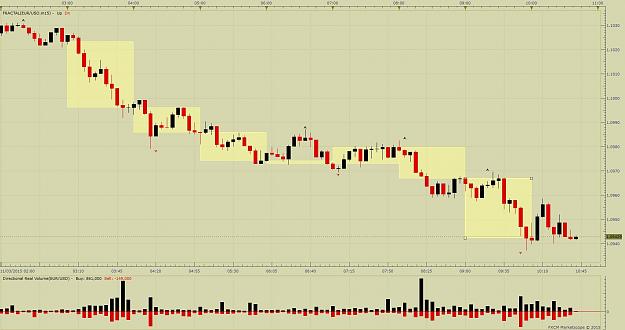
1.So on the chart (1HR) simply place the highest high as the supply and lowest low as the demand,according to ones knowledge of how to place S/D.From the last 5 days.Update the levels as needed, so one is always dealing with what is currently fresh and relevant.
2.Now split the distance in three (I use the fib tool and set the 33% and 66% to make it easy) 3.We now have supply demand and the high area of curve,middle (or equilibrium) area of the curve and the low area of the curve.
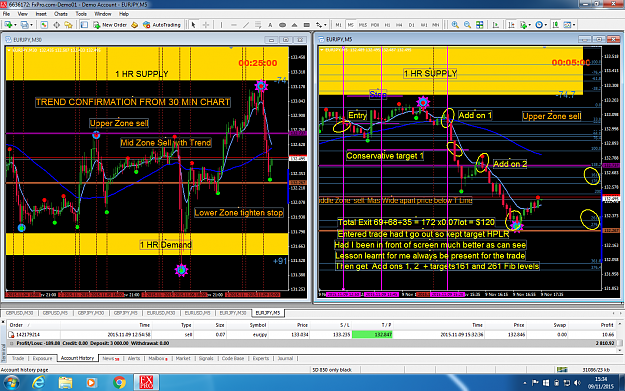
3.Copy this chart onto a five minute chart so that you have on your screen two time frames I find this is most useful for reading where price is going and where it has been I drop the 1 hr to 30 minutes which brings price action to the most recent times.You can work with whatever two time frames you wish depending on your trading style.
4. Now in general one applies the rules of engagement as follows
High on curve sell only
Equilibrium or middle area sell in a down trend and sideways trend sell and wait in an up trend.
Low on the curve Wait until trend turns at Supply then Buy.
The rule of thumb buy sell action is simply In a down trend Sell the bounce and in Up trend buy the dip.
The nearer ones entry is to the extreme of the bounce/dip the better the potential for profit and the lower the risk.
Obviously there is then the application of ones own experience ,knowledge and money management.
I have hopefully attached some charts to show pictorially what I am trying to share.
Hope this is of some value and any comments of a constructive nature are most welcome
Happy Trading
Attached File(s)