Joined Nov 2007
|
Status: left CanaryWharf desk-tea break
|23,520 Posts|
Online Now
Hi C oz remember candles is the thread ,I know nothing of waves ,also trendiness s+r used by candles ,fib as confluence Hussin has used himself
honestly I don't think the down trend line looked like that ,EN hasn't trended for some time
could be bullish higher longer term depend how far you wanna go ,btw something wrong with your data double up months
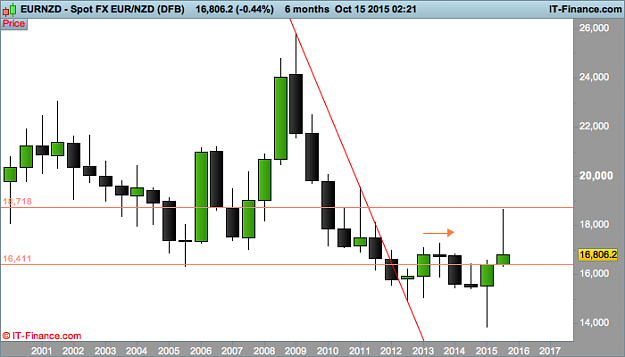
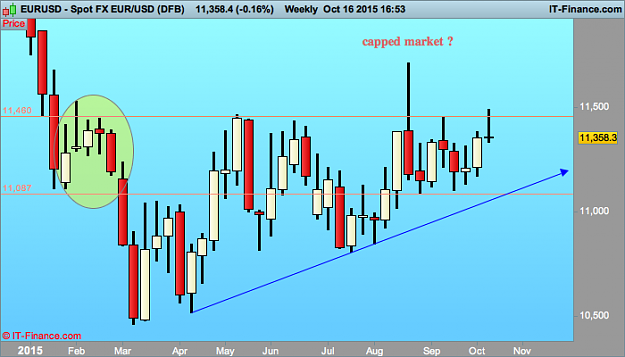
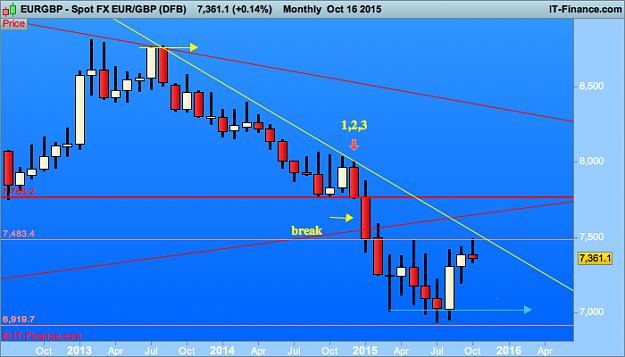
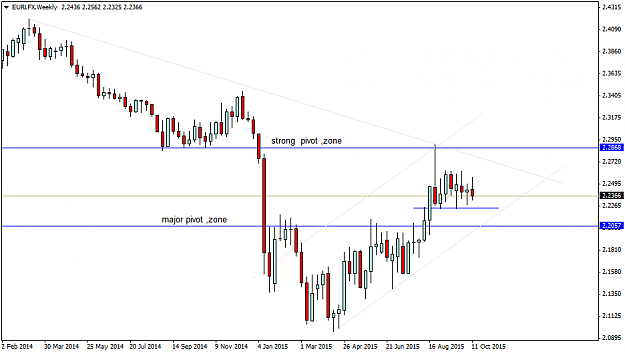
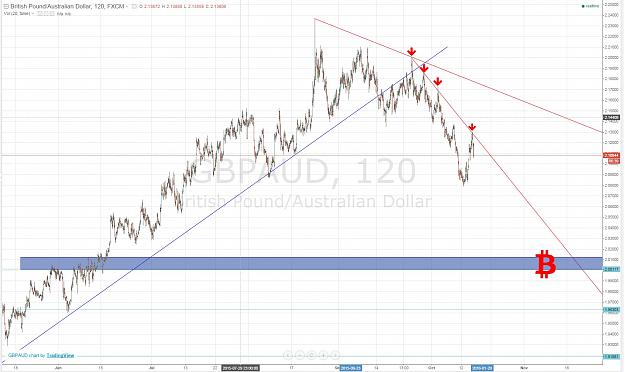
{quote} Hi Bones. The Bulls may not have their work cut out for too long. We may well be presently observing B wave of an ABC back up to around 2.26 {image}
Hi C oz remember candles is the thread ,I know nothing of waves ,also trendiness s+r used by candles ,fib as confluence Hussin has used himself honestly I don't think the down trend line looked like that ,EN hasn't trended for some time could be bullish higher longer term depend how far you wanna go ,btw something wrong with your data double up months {quote} {image}
Joined Nov 2007
|
Status: left CanaryWharf desk-tea break
|23,520 Posts|
Online Now
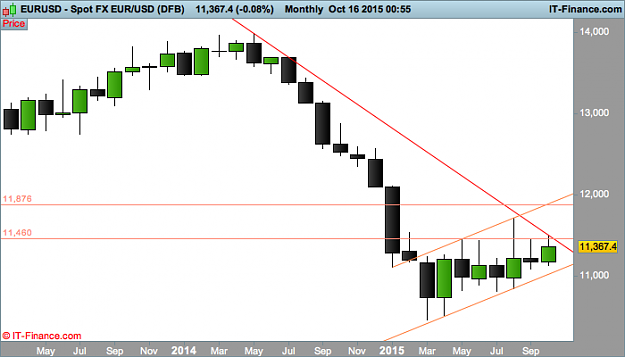
I agree ,I am $ bear something about eur that makes me think it wont benefit as much as others for a while ,news been light eur and well supported as its over a major pivot eur lfx ,
trapped ,ill post next ,
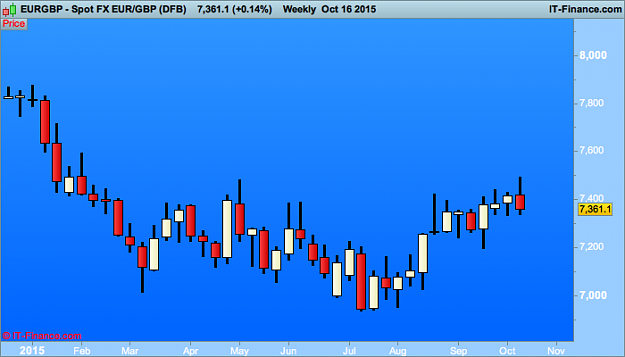
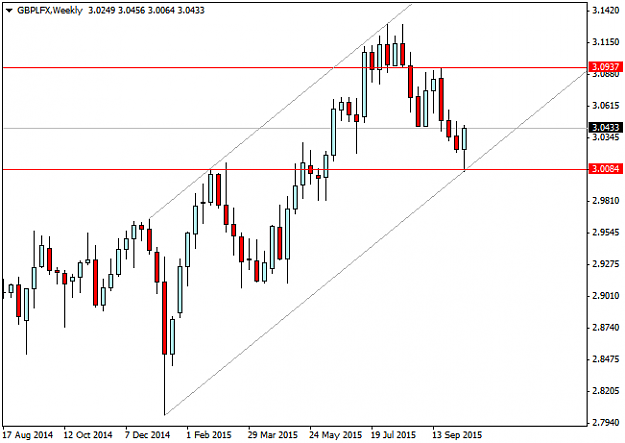
eur gbp has been close to a major down tl ,
Thursday next week could provide answers
Joined Nov 2007
|
Status: left CanaryWharf desk-tea break
|23,520 Posts|
Online Now
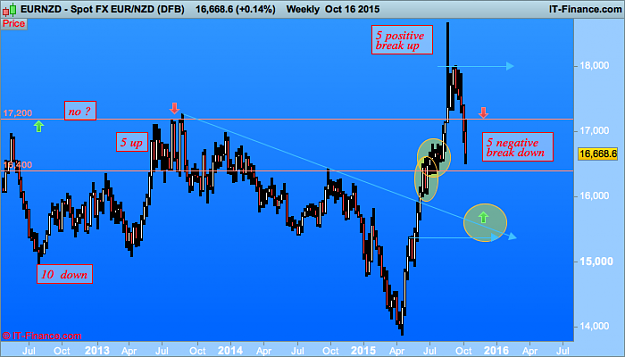
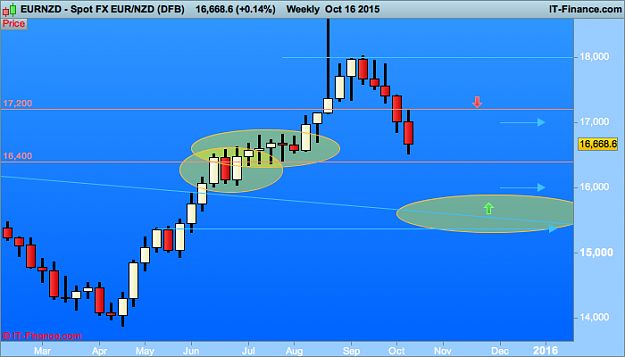
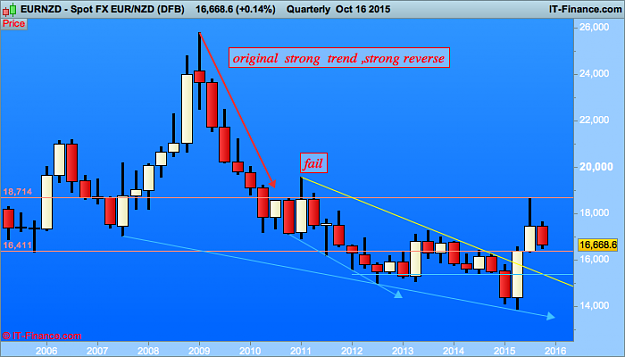
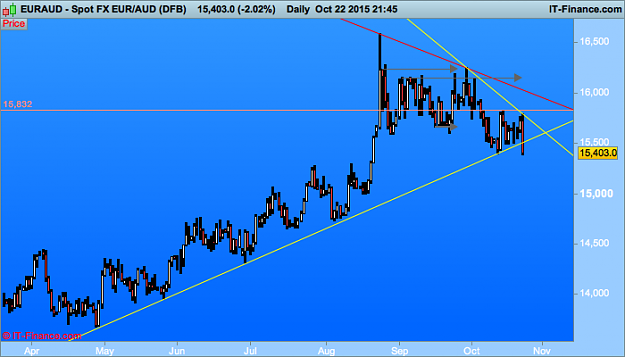
eur nzd has effectively been in free fall for weeks ,under 16400 could seal the fate for the additional 1000 from the 17k mark ,tho this could be a problem area for bears
either way I'm looking sells for a further 5/6 weeks
if its bullish longer term its resetting in a big way ,the chart loves to trend one way or other
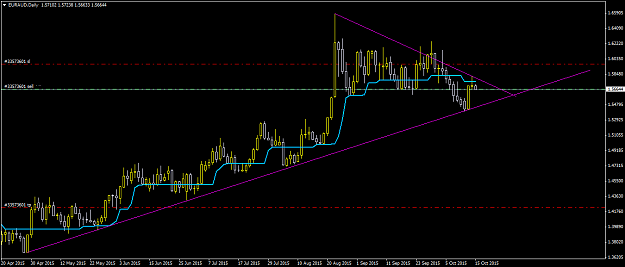
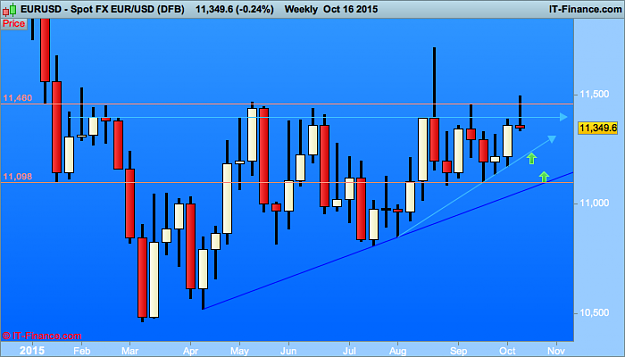
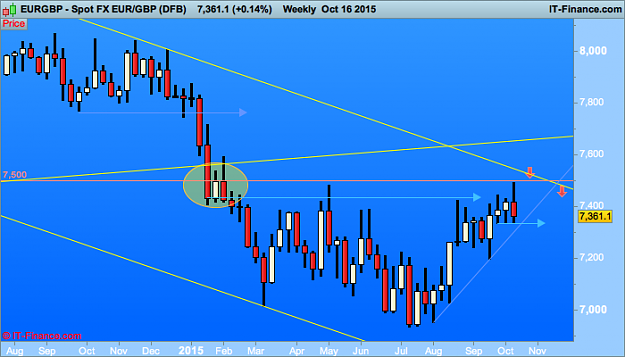
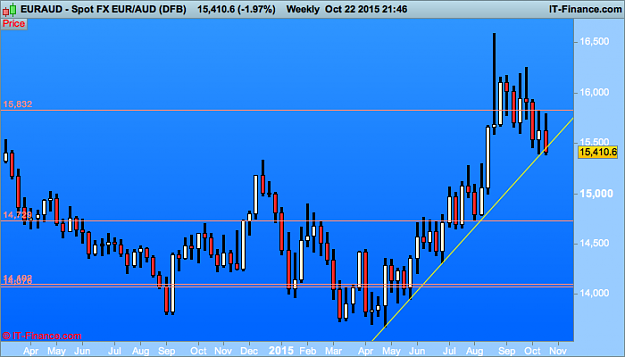
thats a super duper up tl line .and there is a large green d1 from no where ,falters right on the swing high (2014) ,one of the tl down roughly is true imo {image}
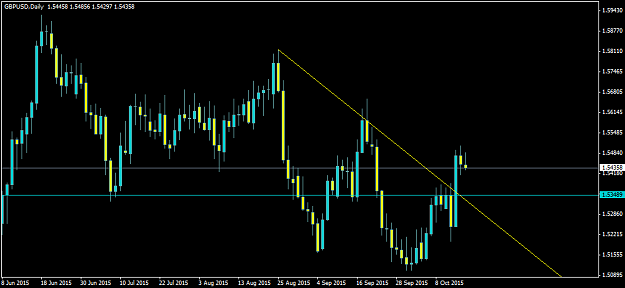
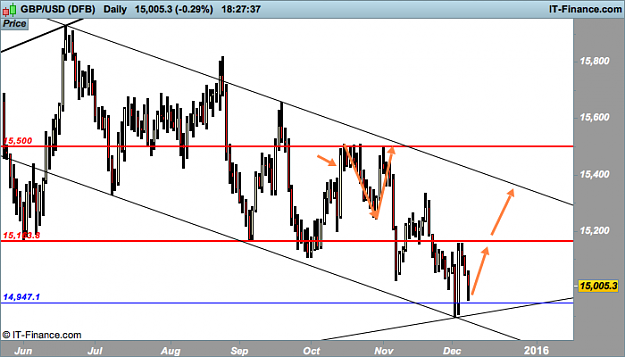
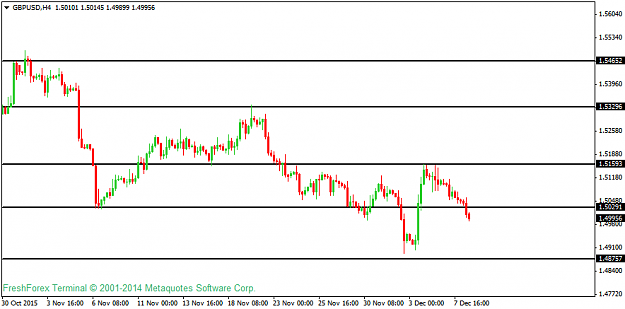
The GBP/USD pair rose from the accumulation territory at 1.4900, to test the distribution territory of 1.5150 (a movement of 250 pips). However, the price needs to move further upwards by 150 pips before the extant bearish outlook can be rendered invalid. Really, the outlook for GBP pairs remains gloomy.
Joined Nov 2007
|
Status: left CanaryWharf desk-tea break
|23,520 Posts|
Online Now
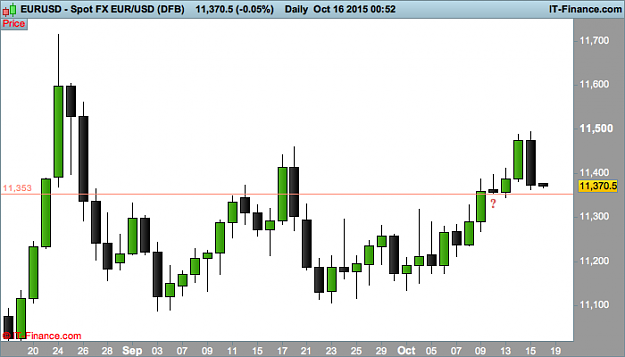
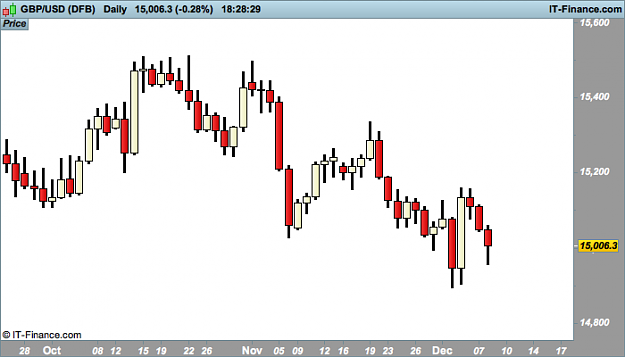
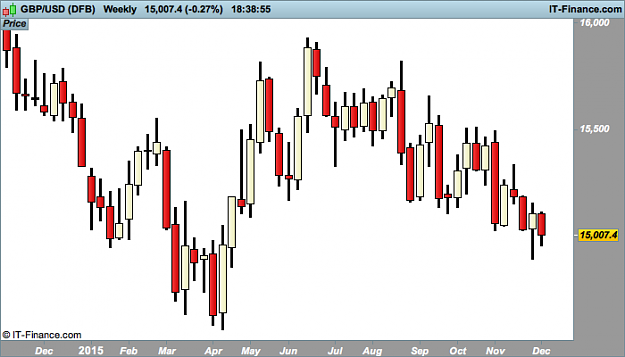
very consolitary down move , ,bullish candles have failed a lot ,this last one closed below res with upper wick ,but about 50% up previous body (shaven)