In an attempt to do proper backtesting, I've started obtaining Dukascopy tick data as described here http://www.forexfactory.com/showthre...60#post8022260
(ie using the tick data downloader, and then importing to mt4 using Tickstory)
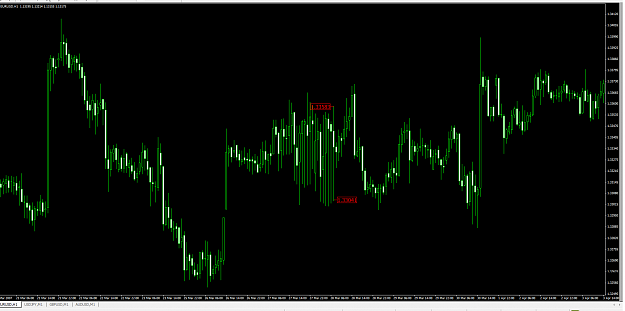
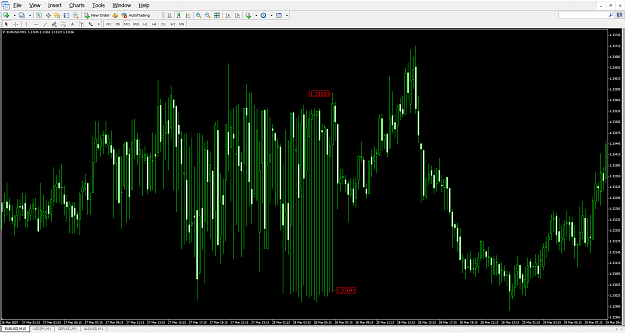
While most of the historic data seems to "make sense" and is similar to that available elsewhere, a couple of points stand out. One example is 28 March, 2007. Here it is on the 15minute chart; huge tails, and very different from the mt4 history centre data.
How can I verify if this data is correct?
(ie using the tick data downloader, and then importing to mt4 using Tickstory)
While most of the historic data seems to "make sense" and is similar to that available elsewhere, a couple of points stand out. One example is 28 March, 2007. Here it is on the 15minute chart; huge tails, and very different from the mt4 history centre data.
Attached Image (click to enlarge)
How can I verify if this data is correct?