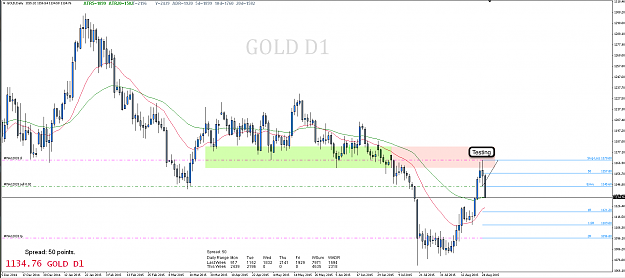
Gold D1 Short Trade
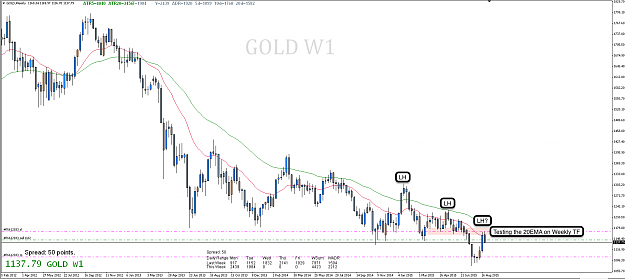
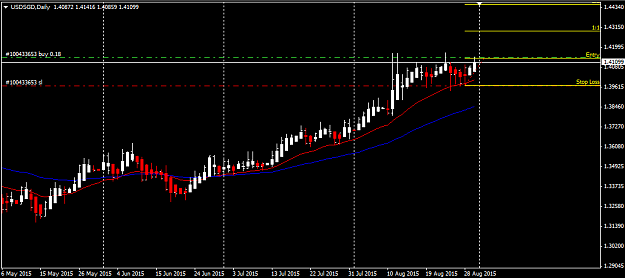
If we are using the 20 and 50 EMA on the Daily TF to look for Dynamic Support/Resistance, to take Trades from, then it makes sense to look for Trade Setups when the 20 and 50 EMA are reached on the Weekly TF. See Gold Chart below.
I tend use the 21 and 55 EMAs simply because they are Fibonacci Levels.
Take a look at the EUR/USD and GBP/JPY Weekly Charts and see how the 55 EMA acted as Dynamic Resistance and Support.
Attached Image(s) (click to enlarge)