@HP I am using last version V3M and until now it looks good. Will watch it very close, if it will freeze again. But kindly explain to me "how" this sync filter is meant to work! I realy do not understand if I use 5 filters only, they are DO, Spread, Relative Strength, B/S Ratio and Sync but it doesn't open a trade, even all conditions are met. For my understanding it should have opened AJ, AU and GA, but nothing happened! {image} @all: Kindly do not send any change requests to me, adress them to the programmer. I don't have...
Ignored
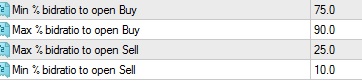
Maybe the trades were not opened because they do not meet the settings of these parameters?
{quote} EA is showing amount minus my commission (which is already booked to my account). No idea, have a look at payed commissions, fixed spread, swap.....
Ignored
positive inclusive commission, still same info
Scan all 28 Forex pairs with ONE chart... Currency Strength28 Indicators
|
Joined Jun 2015
|
Status: Trader & Developer
|24 Posts
I did some experimenting with rolling bidratios and accessing past ratios with different price types (close, median, typical...) and the difference of adding or subtracting quote currency. And it really shows how bad idea it is using same day's high and low for calculation when day changes...
So after reading all this talk about spaghetti indicators, here is one more if somebody wants to experiment (and now I want some spaghetti, getting hungry...)
I did some experimenting with rolling bidratios and accessing past ratios with different price types (close, median, typical...) and the difference of adding or subtracting quote currency. And it really shows how bad idea it is using same day's high and low for calculation when day changes... So after reading all this talk about spaghetti indicators, here is one more if somebody wants to experiment (and now I want some spaghetti, getting hungry...) {image} {file}
Ignored
great!.. does it use your excel formula with polynomial and absolute dynamic, whatever that is
{quote} great!.. does it use your excel formula with polynomial and absolute dynamic, whatever that is
Ignored
No it doesn't, I don't understand how should I use that? I can't draw 28 spaghettis on screen and it's used for their relative strength calculation. Not absolute strength.
I did some experimenting with rolling bidratios and accessing past ratios with different price types (close, median, typical...) and the difference of adding or subtracting quote currency. And it really shows how bad idea it is using same day's high and low for calculation when day changes... So after reading all this talk about spaghetti indicators, here is one more if somebody wants to experiment (and now I want some spaghetti, getting hungry...) {image} {file}
Ignored
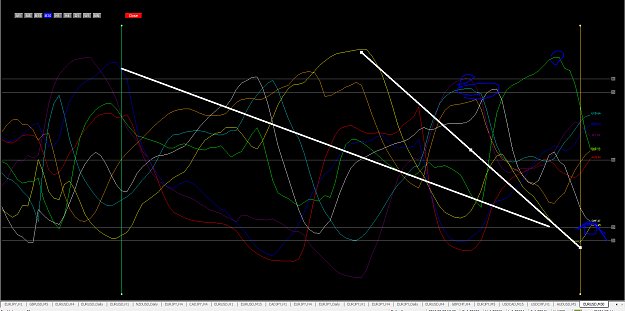
if its running in cycles then when one color spaghetti is at the top at the same time as another color spaghetti is at the bottom and they turn toward each other....you have a perfect oportunity for good rr...or as blue said when one retraces and then u can expect it to complete its mission.....
mikka maybe this idea helps you to make an indicator
{quote} No it doesn't, I don't understand how should I use that? I can't draw 28 spaghettis on screen and it's used for their relative strength calculation. Not absolute strength.
Ignored
when spaghetti reaches the top end and then turns down it WILL go to the bottom end again, and vice versa...THAT is powerful
90%
if i'm not mistaken there is a correlation table built into hotpotatos spaghetti...that's why it works
I did some experimenting with rolling bidratios and accessing past ratios with different price types (close, median, typical...) and the difference of adding or subtracting quote currency. And it really shows how bad idea it is using same day's high and low for calculation when day changes... So after reading all this talk about spaghetti indicators, here is one more if somebody wants to experiment (and now I want some spaghetti, getting hungry...) {image} {file}
Ignored
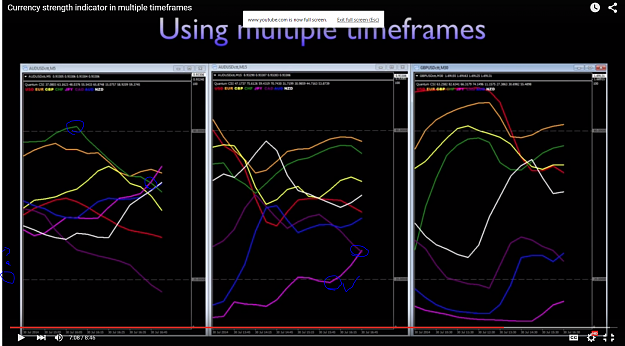
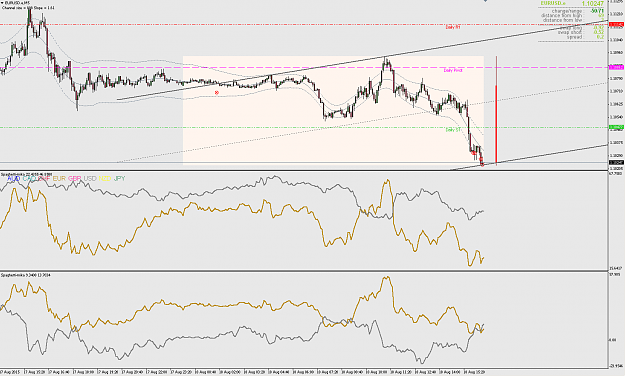
I have no (real) idea of what I'm looking at... so a (wild ass) 'guess'....
The widows/lines show the 'spread' or level of 'disagreement' between supply/demand... (bid ratio)
the 'closer' the lines the less 'disagreement' over price between buyers and sellers.
The Top spaghetti window is 'same day' and the bottom window is rolling?
{quote} when spaghetti reaches the top end and then turns down it WILL go to the bottom end again, and vice versa...THAT is powerful 90% if i'm not mistaken there is a correlation table built into hotpotatos spaghetti...that's why it works
Ignored
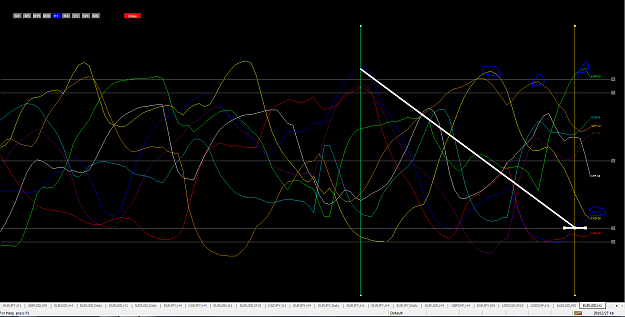
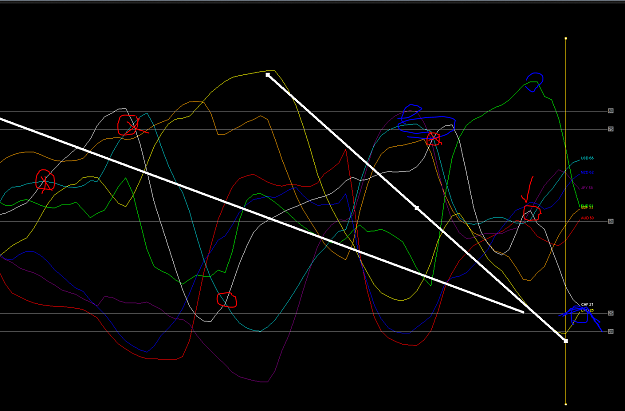
Do not forget the crosses at 55 and 45, it makes the other 10% when it turns around and doesn't make it to the top.
{quote} I have no (real) idea of what I'm looking at... so a (wild ass) 'guess'.... The widows/lines show the 'spread' or level of 'disagreement' between supply/demand... (bid ratio) the 'closer' the lines the less 'disagreement' over price between buyers and sellers. The Top spaghetti window is 'same day' and the bottom window is rolling?
Ignored
i think the spaghetti show a kind of ema for the currency strength for the TF. surely its not a single candle
Scan all 28 Forex pairs with ONE chart... Currency Strength28 Indicators
{quote} when spaghetti reaches the top end and then turns down it WILL go to the bottom end again, and vice versa...THAT is powerful 90% if i'm not mistaken there is a correlation table built into hotpotatos spaghetti...that's why it works
{quote} I have no (real) idea of what I'm looking at... so a (wild ass) 'guess'.... The widows/lines show the 'spread' or level of 'disagreement' between supply/demand... (bid ratio) the 'closer' the lines the less 'disagreement' over price between buyers and sellers. The Top spaghetti window is 'same day' and the bottom window is rolling?
Ignored
Both are rolling, only difference is that other one subtracts quote currency's bidratio from the total strength.
And it's not using any moving averages, if I had wanted that I would've just used CCFp or some other spaghetti indicator that uses moving averages..
{quote} Both are rolling, only difference is that other one subtracts quote currency's bidratio from the total strength. And it's not using any moving averages, if I had wanted that I would've just used CCFp or some other spaghetti indicator that uses moving averages..
Ignored
AUDCHF as example.
Cross outside 45/55, no impact, same direction.
Cross inside, action and price.
{quote} if its running in cycles then when one color spaghetti is at the top at the same time as another color spaghetti is at the bottom and they turn toward each other....you have a perfect oportunity for good rr...or as blue said when one retraces and then u can expect it to complete its mission..... mikka maybe this idea helps you to make an indicator 2 cents {image} {image} {image} {image} {image}
Ignored
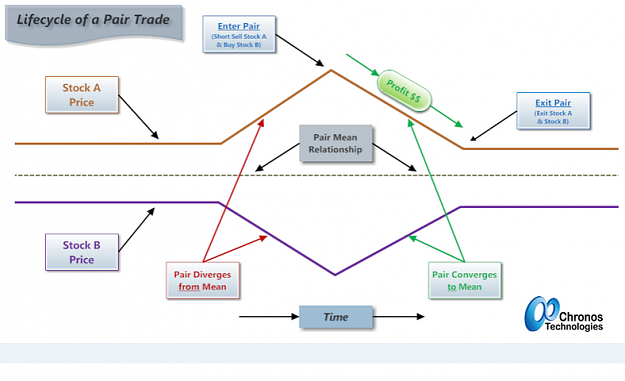
Converging/diverging pairs.
Problem is there are a lot of combinations to monitor.
Why is it that nobody is responding to my PM's and requests? Is it that the idea is wrong or it's simply not code-able? Manually, it works and I believe that it is code-able as well.
I really need help, please. Below is the link to details of my request.