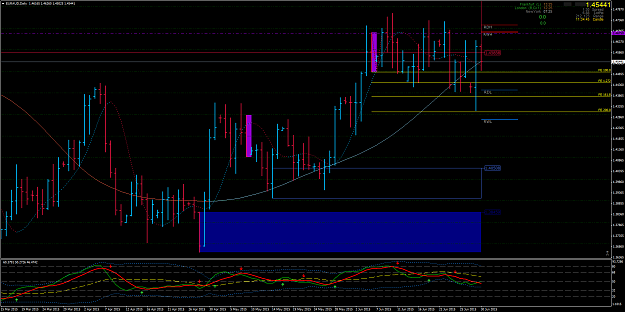
DislikedI would like to understand a bit more about big picture planning. For instance GBPNZD, in its monthly chart - we saw the strong trend in bullish in June but in the weekly chart - it is in extremely overbought areas with TDI hooking down. In the day chart, there is a divergence. Is it right to analyse that the GN will continue to have strong momentum to trade up to 2.41 region - the next nearest resistance area? {image}Ignored
On Monthly, Weekly and Daily chart TFs, I ignore the TDI overbought and oversold levels. Price action will tell you the volatility and range for trading. Just look out for big candles and small candles.
Have you done your Big Picture Planning? Are there any Historical Price swing levels in the regions where the market is trading now?
Is the June MN candle a WRB? what is its range? Do you know a 50% retracement is good for 500 pips?
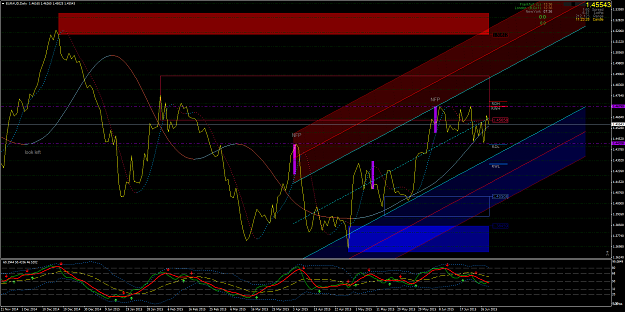
What about the Weekly chart, what do you see in the PA?
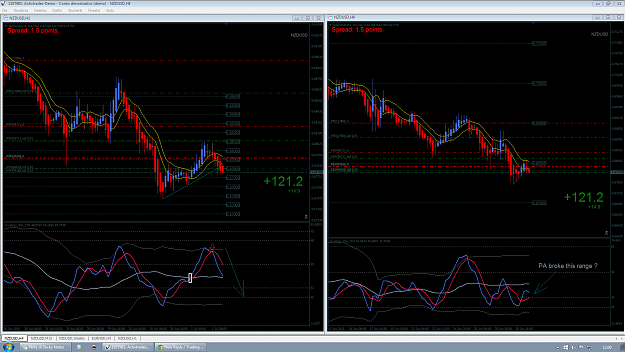
Look at GBPUSD and NZDUSD correlation strength with GBPNZD.
Honesty is a very expensive gift. You wont find it in cheap people.WBuffett
1