{quote} Thanks Hiero. Will try to do myself before posting next time. Learning a lot from you. Thanks, LO-Trader
Ignored
No problem. I learn every day, about every month I sit back and think how I thought I even knew how to trade the previous month. Rinse and repeat. Like M. Douglas says in Trading in the Zone though, none of this learning will do you a lick of good, until you understand and accept the realities of trading and the Market. We must create our own language to read the market, that has infinite possible ones and we must give rules to a void, that has no rules. We also must rise above our basic human programming, because it's the very thing that will cause you to fail. And all this can only be done by each individual trader, with very little help from anyone else. A rather daunting task. I used to think that finding an edge was going to be the hardest part of becoming a trader, now I know, being able to read a chart like like my own language and having an edge, is the most basic requirement to passing the neophyte stage.
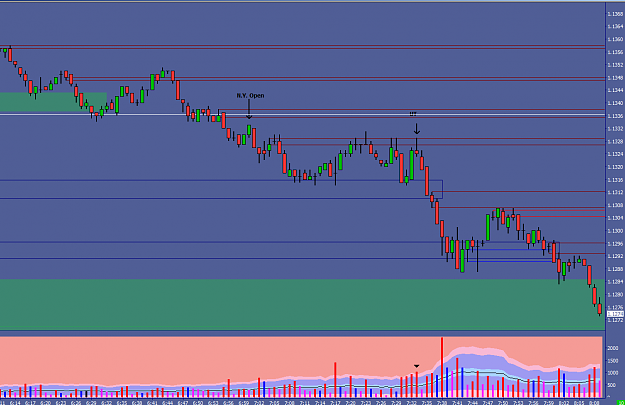
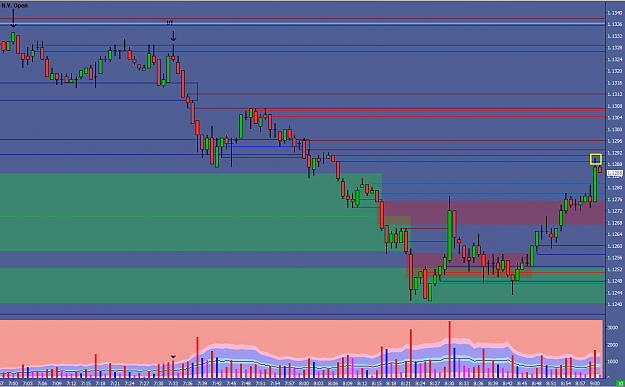
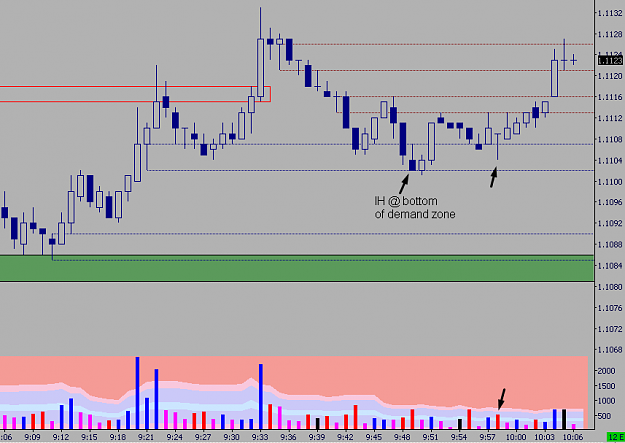
Hi Hiero, Volume looks to be much better today on NIFTY option. Below chart is on M5 time frame. When I look back now I feel like it is following VSA principles. 2: volume was too high and bar closed below 30% of the range. Lot of selling. 4 & 5: looks like stopping volume 6: less volume on a upbar. ND. no sign of going up. But SOS. 7: was a successful test. 8: supply coming back to market. 9: was a successful test as the next bar was up. A: was a successful test as the next bar was up. B: supply swamping demand. SOW. But next bar was a successful...
Ignored
One other major point here, candle "B" was more than supply swamping demand, it was someone (or someones or MM or SM ect) absorbing supply. You have to always decipher what these kind of candles are after a WRB, real weakness (like an upthrust) or hidden strength (what I consider to be an inverted hammer out of place) and vice versa for the reverse situation.
{quote} One other major point here, candle "B" was more than supply swamping demand, it was someone (or someones or MM or SM ect) absorbing supply. You have to always decipher what these kind of candles are after a WRB, real weakness (like an upthrust) or hidden strength (what I consider to be an inverted hammer out of place) and vice versa for the reverse situation.
Ignored
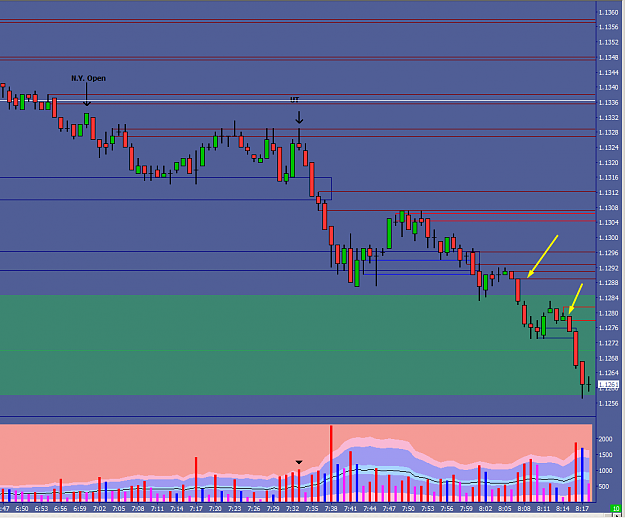
Sorry. I m not able to get this point very clearly. How can I make out its a inverted hammer or upthrust? Both looks similar.
One SOS what I can see is on the previous bar of "B". Its a nice up bar with good volume but not ultra volume, which signifies strength. Or is that your point is "Bar B shows duality". And wait for further signs?
{quote} Sorry. I m not able to get this point very clearly. How can I make out its a inverted hammer or upthrust? Both looks similar. One SOS what I can see is on the previous bar of "B". Its a nice up bar with good volume but not ultra volume, which signifies strength. Or is that your point is "Bar B shows duality". And wait for further signs? Thanks, LO-Trader
Ignored
Yes I mean they have a dual nature, must wait and see.
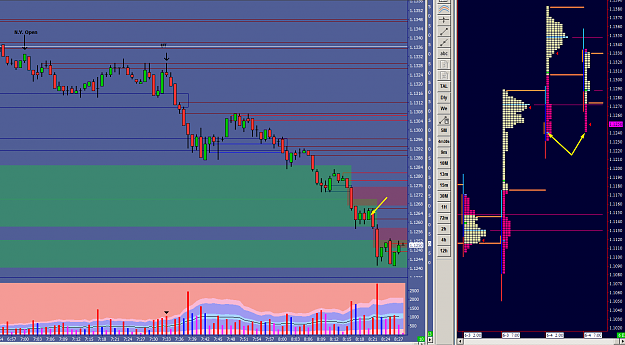
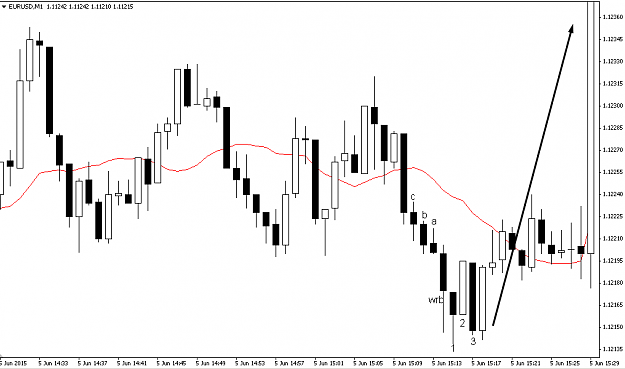
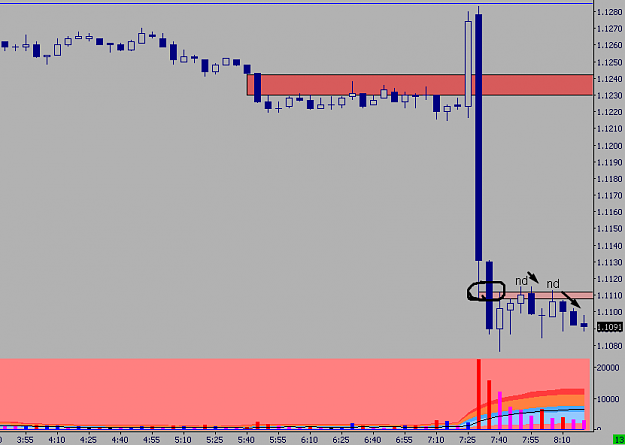
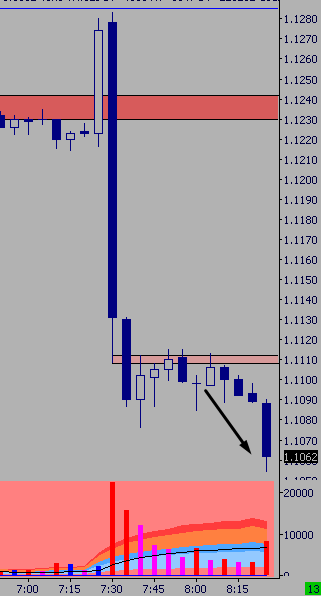
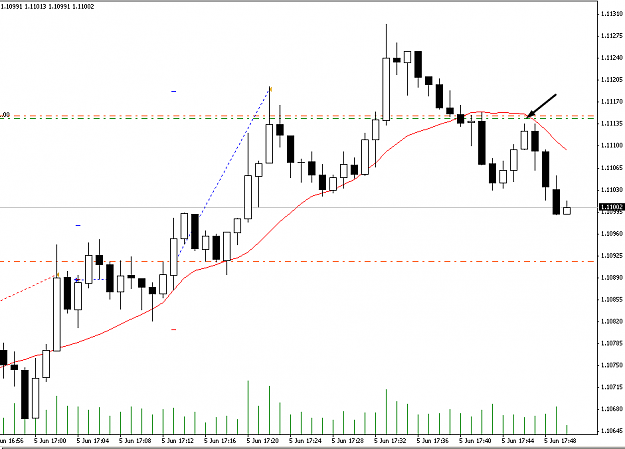
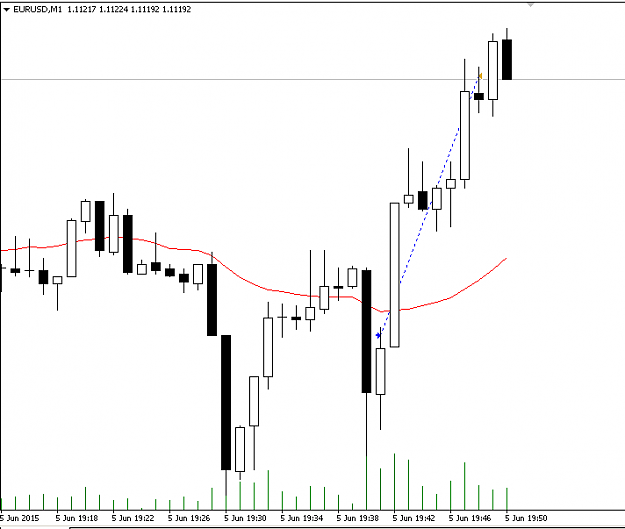
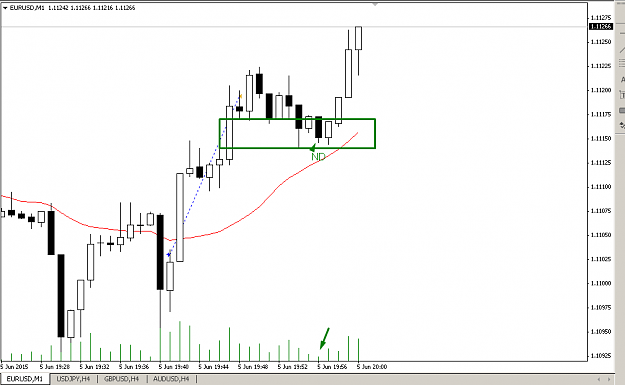
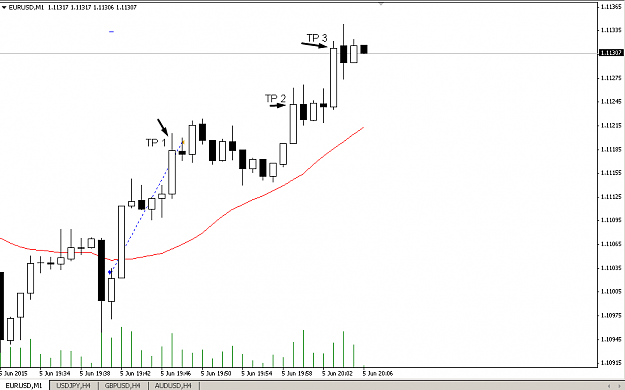
This is a demo trade here. I'm rather surprised even in demo, my take profit was not honored. I had a 10 pip stop and 45 pip TP and it shot up past TP and then slammed down, way down. Confirmation entry here.
1m
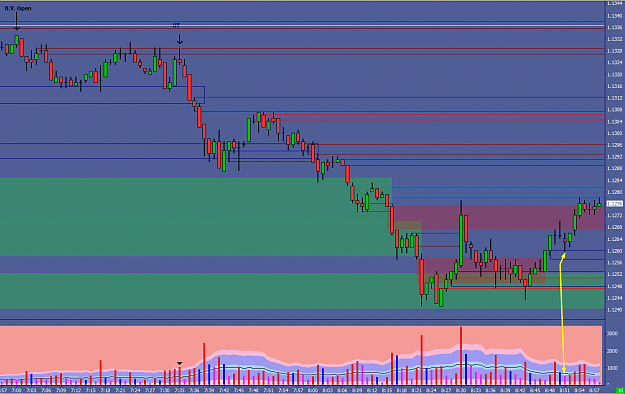
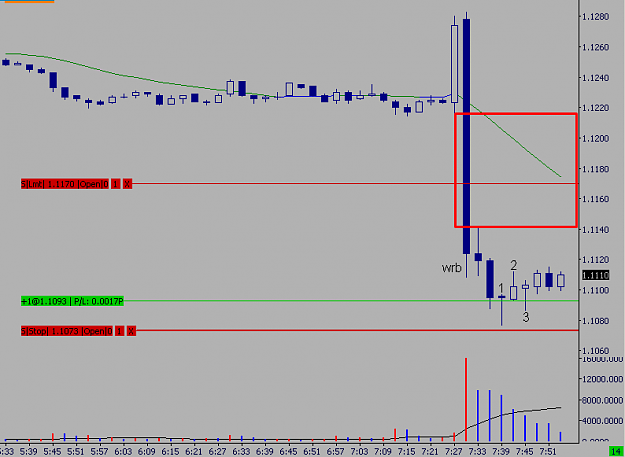
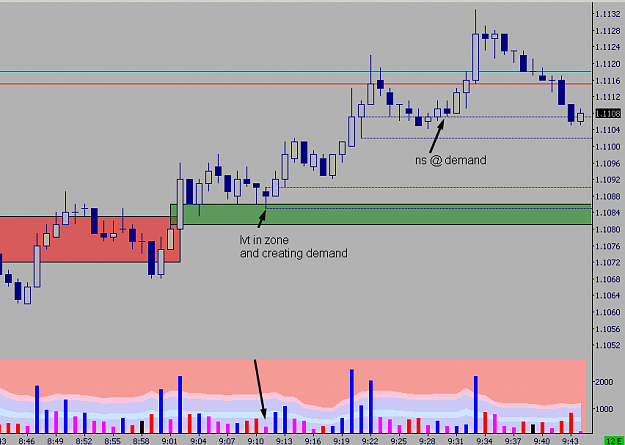
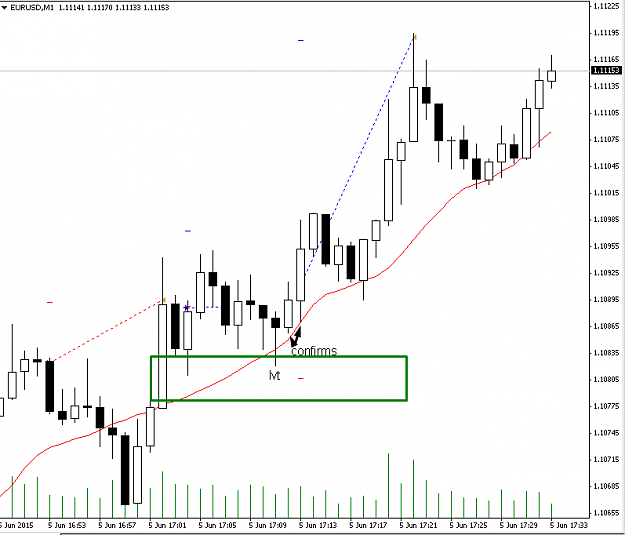
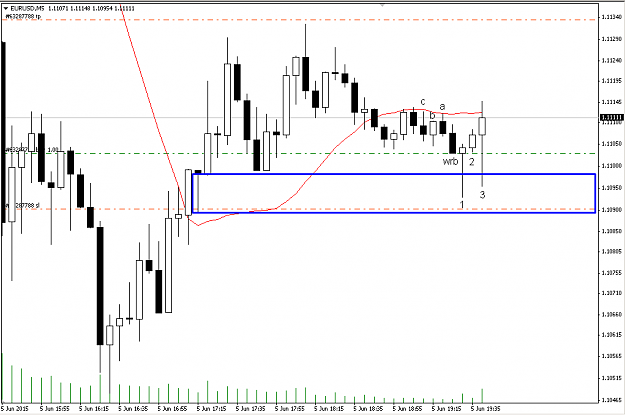
Just shorted here on a return to failed test, would have taken the fail but I was too slow. I still don't know if I should scalp these, I'd be up a lot more today if I did. The other loser would have been +15 and this +15 too, currently it's back up close to entry.
1m