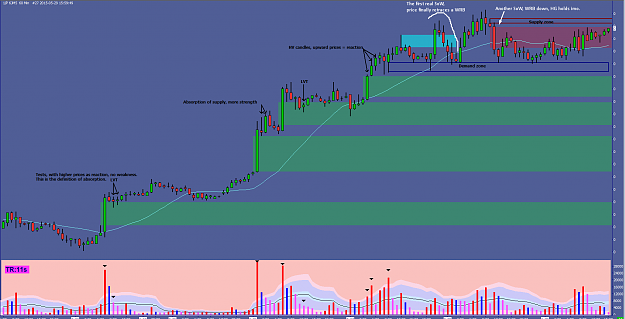
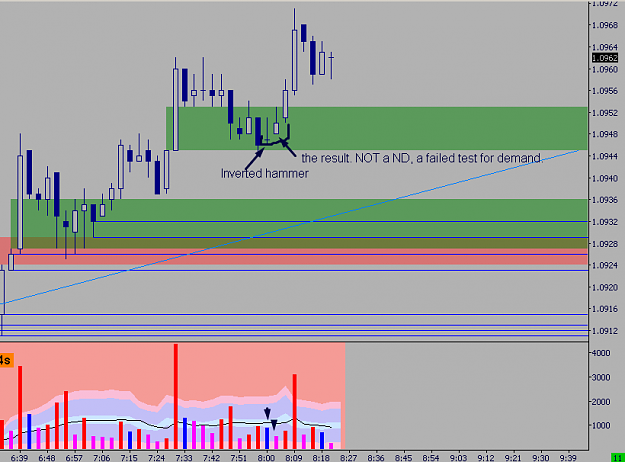
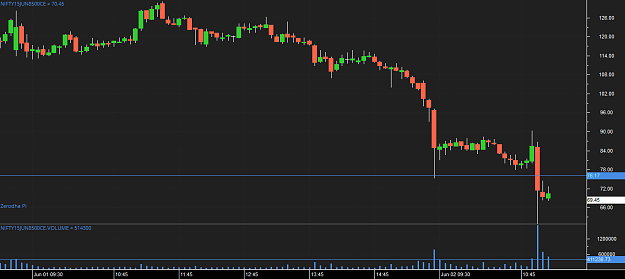
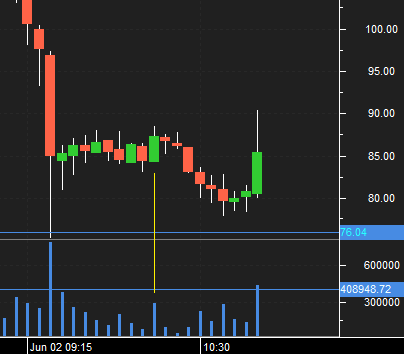
Disliked{quote} You have to watch and see how price reacts to SOS/SOW. Does the next bar confirm the SOS? Is price staying above or below the SOS? Are the test succeeding or failing? Is price trending up? Down? Or sideways? That AU chart has a SOW (described in black wording) and Absorption volume (in white wording) {image}Ignored
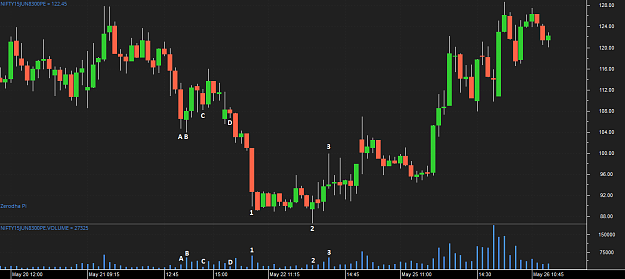
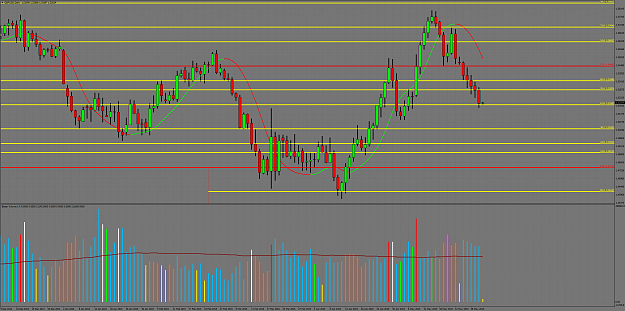
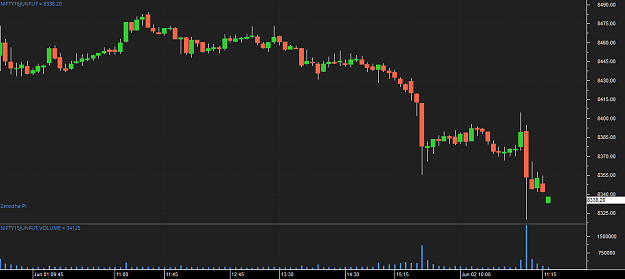
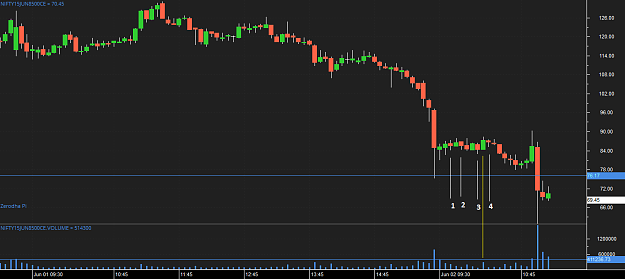
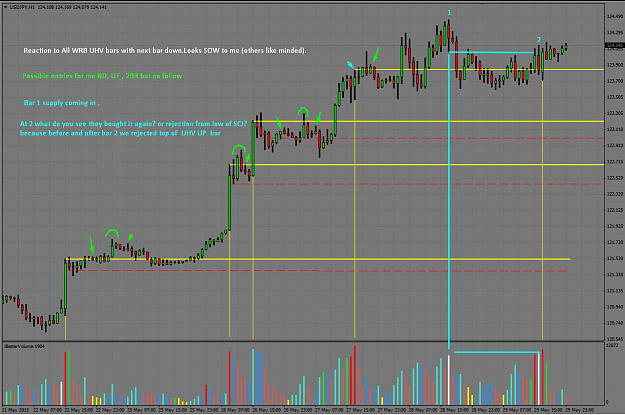
to me on chart i posted it looks like still bullish..if i followed you correctly.. because we are above UHV up bar and also above bar no 2 close and seen a test recently.. right??..kindly review that
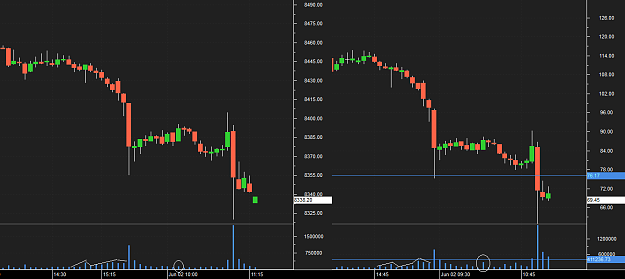
Attached Image (click to enlarge)
Think Twice Low Volume is Key to Success