Joined Mar 2008
|
Status: PVSRA with Traderathome
|23,249 Posts
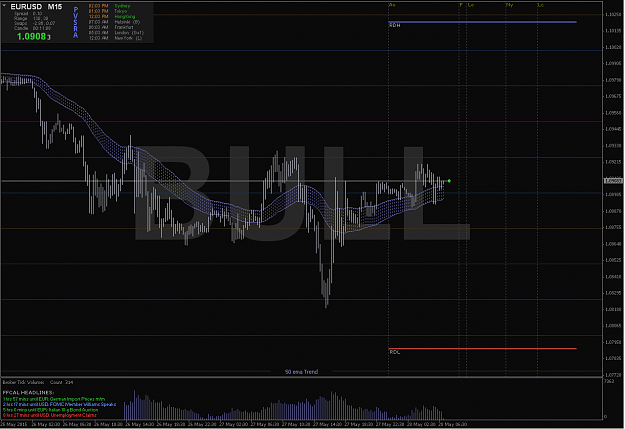
EURUSD
So far in this AS the price has been just ever so slightly trending up, with increasing activity, but with the most recent highest levels of activity being when the price suddenly dropped below the whole number and recovered. This is a PVSRA indication of bulls. And this is nice because PA is trending up since the spike low yesterday. That could have been a stop hunt of SM longs previously filled by the MMs!
So, bullish it is. And I would anticipate another move below the whole number today, maybe in conjunction with the coming USD release. Whenever it occurs, it might be a good opportunity for a long entry. Time will tell.
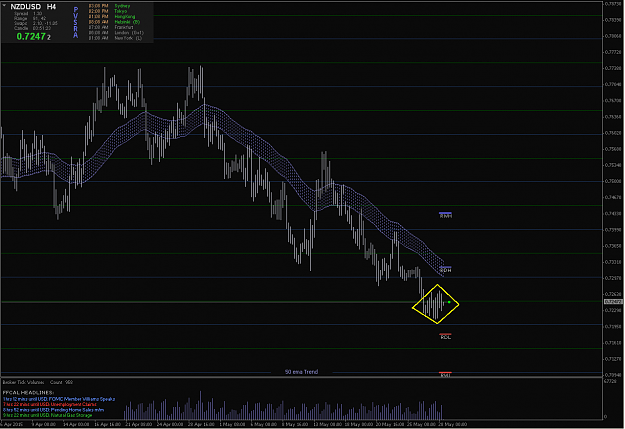
NZDUSD Outlook: Based on H4 TF, for me its look like some steps of accumulation phase. Price drop from above whole number 0.73000 (as previous support) into the lower level below half number 0.72500. The previous support (whole number 0.73000) broke with huge activity - the spread is wide. The last giant activity (red - bearish volume - point B on my ss) did not generate wider spread bar as the first bar which broke the previous support (Bar -point A on my ss), whereas this activity higher. It could be selling climax. After this climax, there is...
Ignored
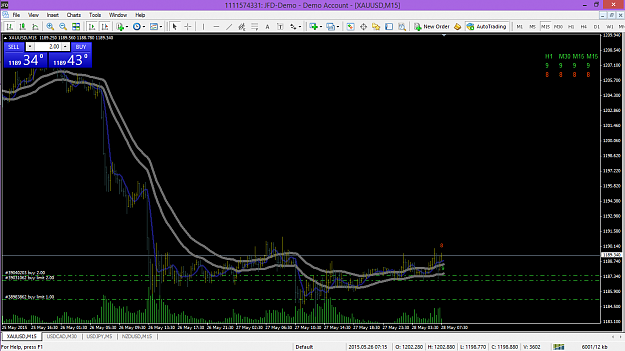
NZDUSD
And in further support of Mauro-J's PVSRA assessment, we have this bullish pattern developing.
Attached Image (click to enlarge)
And good consolidation (building) below the half Level in this AS.
{quote} since i don't know where the price will move on the next future time, its better to protect my gains with safety belt. Although based PVSRA I conclude that for the time this market is still bullish, but sometimes MMs will whick n whack the price to creat more liquidities for their own. Wanna hit my SL? hit it...., and i still on a blue line. And if this SL + hitted, during PVSRA still indicating bullish, I'll look for opportunities to go longs on other better momentum. This is how i trade. Minimize the risk, n maximize profit consistently....
Ignored
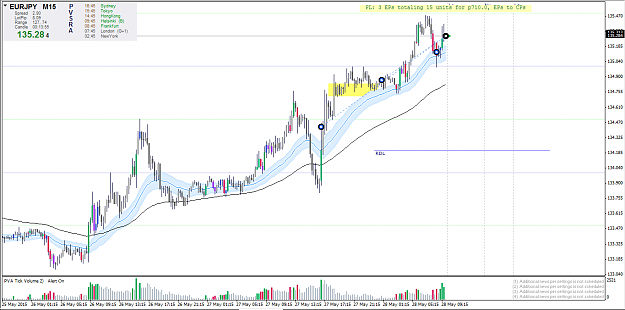
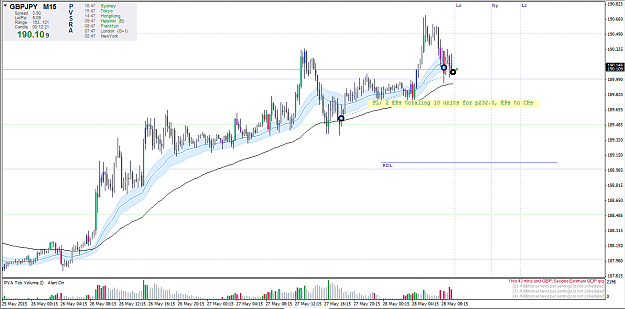
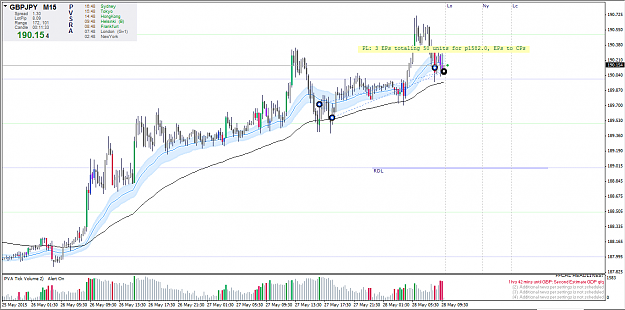
EUROJPY ; GBPJPY Long trades closed
Attached Image(s) (click to enlarge)
"Bulls make money, Bears make money, but hogs get slaughtered"
NZDUSD Outlook: Based on H4 TF, for me its look like some steps of accumulation phase. Price drop from above whole number 0.73000 (as previous support) into the lower level below half number 0.72500. The previous support (whole number 0.73000) broke with huge activity - the spread is wide. The last giant activity (red - bearish volume - point B on my ss) did not generate wider spread bar as the first bar which broke the previous support (Bar -point A on my ss), whereas this activity higher. It could be selling climax. After this climax, there is...
Ignored
What a great insights , this is what I call a great content and learning material. Btw. There is my favourite inverted H&$ pattern on NZDUSD H1 to further confirm your already deep analysis. Unfortunately I can,t post a ss , i am on my smartphone at the moment. Take care !G.
HI, I have been reading very interesting explanation on how the market works based on PVSRA. Thanks to the generous sharing from the members here.
I have attached a zoom out range bar chart and was wondering if the method of PVSRA can be explained here for learning. Especially the SM and MM entry zones. I do not have the indicators to study the chart more in depth as I just came across this thread. So hope to hear from the experienced and the seniors.
{quote} What a great insights , this is what I call a great content and learning material. Btw. There is my favourite inverted H&$ pattern on NZDUSD H1 to further confirm your already deep analysis. Unfortunately I can,t post a ss , i am on my smartphone at the moment. Take care !G.
Ignored
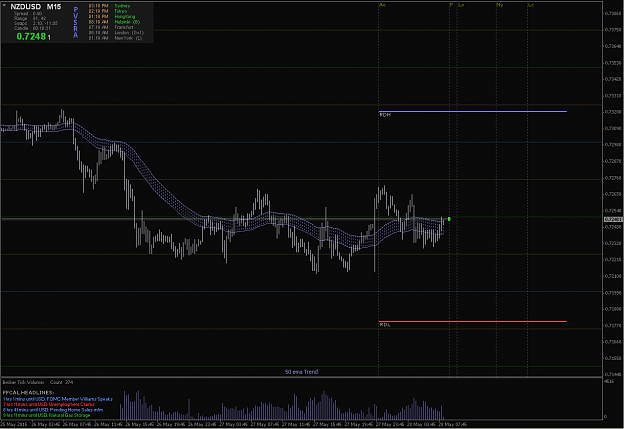
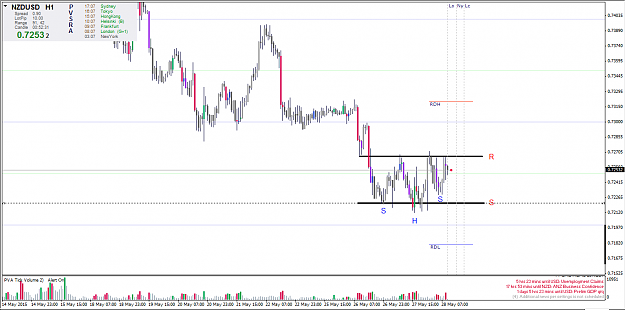
Based on H1 TF :
If u mean that is "inverted HnS" as a sign pattern to reversal i agree.
If u mean thet is "HnS" i dont agree, cz HnS only happen while the trend is bullish and prepare to reversal.
And if it trully "inverted HnS", It would confirmed if the Resistance broken. And maybe i will utilize the pullback bouncing for longs oportunities EP.
But, if the price fall again from that above half level 0.72500 and break the support, its still not HnS confirmed, thats just spring test follow the big picture (H4), and not the sign of bearish continuation. But,im not sure it will happen. If it happen, i think the "spring" will not go further as a bearish continuation, at least just below whole level 0.72000, no more. Anything could be happen, as we have seen all time how the robber MMs creat their liquidities to amplify their own.
That is all how it looks for me..
Attached Image (click to enlarge)
"Bulls make money, Bears make money, but hogs get slaughtered"
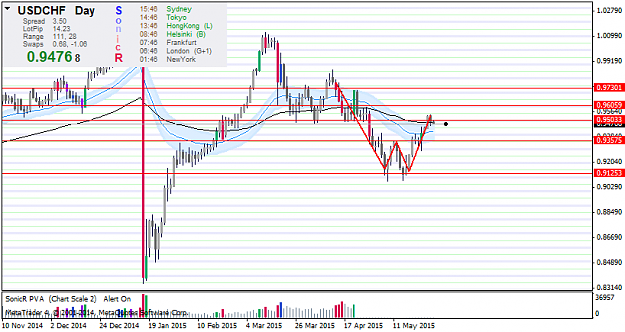
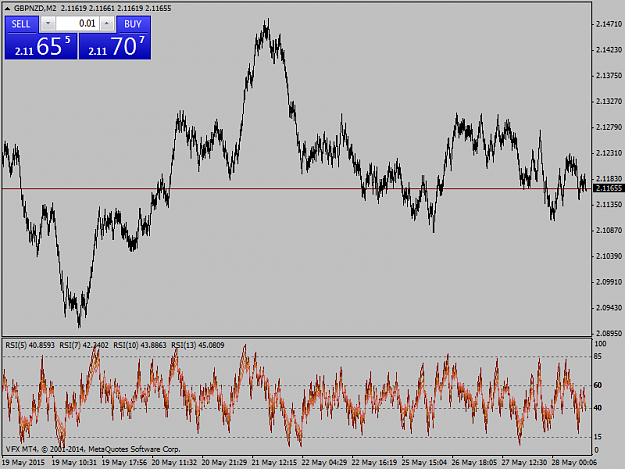
HI, I have been reading very interesting explanation on how the market works based on PVSRA. Thanks to the generous sharing from the members here. I have attached a zoom out range bar chart and was wondering if the method of PVSRA can be explained here for learning. Especially the SM and MM entry zones. I do not have the indicators to study the chart more in depth as I just came across this thread. So hope to hear from the experienced and the seniors. Appreciate any kind comments. TraderInc {image}
Ignored
TraderInc;
Firstly, I want to welcome you, wellcome to our school.
And the second, i wanna ask you, "Are you using renko chart"? i can see from your ss, there is M2 tf label.
"Bulls make money, Bears make money, but hogs get slaughtered"
{quote} TraderInc; Firstly, I want to welcome you, wellcome to our school. And the second, i wanna ask you, "Are you using renko chart"? i can see from your ss, there is M2 tf label.
Ignored
Hi MJ, thanks for the welcome.
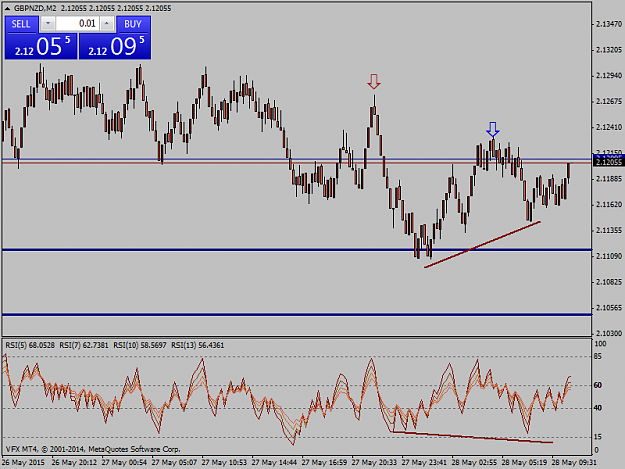
I am using constant range bar. It's to pick the consolidation areas (hopefully). For this chart, volume indicator cannot work on it so I am dependent a lot on the SR areas.
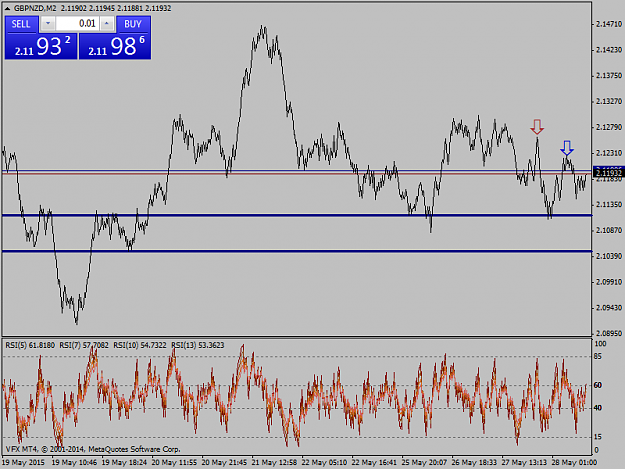
In about an hours time, the GBP will have the news on 2nd Qtr q/q estimate. So I am expecting the price to enter the support zone (2 parallel lines) basing on the forecast to be weaker than expected. As you can see that the red arrow was the point where the Greek story didn't turn out positive last night and since then the price could not recover upon retracement (blue arrow). Right now the price is hovering between the upper half of 2.1170 to 2.1190. A fakey long to draw buyers?
Joined Jan 2015
|
Status: PVSRA with Traderathome
|1,621 Posts
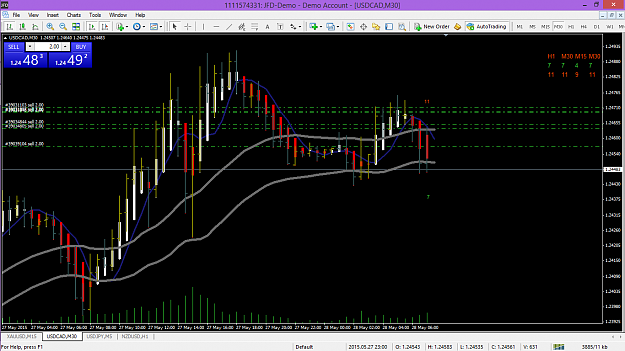
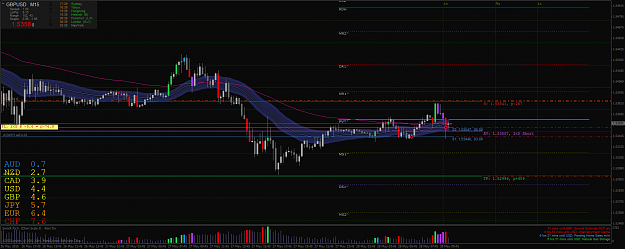
GBPUSD Short Trade Open:
The same indication as previous 2 days, just different trade direction. Counting on sucker for the last time. Suspect they want to reload longs lower- below the half level. There is time enough before the high impact USD news.
{quote} Hi MJ, thanks for the welcome. I am using constant range bar. It's to pick the consolidation areas (hopefully). For this chart, volume indicator cannot work on it so I am dependent a lot on the SR areas.
Ignored
I think, constant range bar has a way of working that is almost similar to renko. both only work on offline chart mode by the history of the past range of the bars within a certain time. If u used it to get better views of the SR - consolidatioan area, i think that fine. But, im not sure that the "constant range bar" will be able to be applied properly in this PVSRA. As you said, the volume indicator doesnt work on this type chart. Whereas we need the volume to read the market as an activity on certain bar. Thats why, in this reading system there is volume variabel inside. Moreover, we need an information of the open and close formed by the bar, and not just the fix spread of the bar as "constant range bar" shown. So, with this "constant rang bar" we will lose one of the important information for PVSRA market reading.
On Post#1 - Page 1, TAH has said that the new indicator - template will launch as soon as possible, we wish it would launched on 1 Juny. So, we need to wait patiently. And for alternative as a temporary template, u can creat own, just add tick volume indicator on your chart, and EMA 34 (low, close, high), and for the trend u can attach EMA 89 (high). And read the Post#1 carefuly and and understand as well as possible. For the support information to study this PVSRA system reading, u can read other post from the other contributors members in this thred. thats all.
-MJ
For additional :
We dont use RSI too on this PVSRA. The reading based on PVSRA, and to get a good timing to jump we use EMA or SR level after reading the market with PVSRA.
"Bulls make money, Bears make money, but hogs get slaughtered"
{quote} I think, constant range bar has a way of working that is almost similar to renko. both only work on offline chart mode by the history of the past range of the bars within a certain time. If u used it to get better views of the SR - consolidatioan area, i think that fine. But, im not sure that the "constant range bar" will be able to be applied properly in this PVSRA. As you said, the volume indicator doesnt work on this type chart. Whereas we need the volume to read the market as an activity on certain bar. Thats why, in this reading system...
Ignored
Hi MJ, thanks for the reply on that. I understand the limitations to the offline charts . RSI was the next best thing that I could use. And I appreciate your recommendations on the tick volume indicator and EMA. I will continue to follow this thread to learn more from you guys.
{quote} Hi MJ, thanks for the reply on that. I understand the limitations to the offline charts . RSI was the next best thing that I could use. And I appreciate your recommendations on the tick volume indicator and EMA. I will continue to follow this thread to learn more from you guys. TraderInc
Ignored
Read - read - n read many times, practice and practice on over and over times - consistenly with this PVSRA. Thats all we have to do.
-MJ
"Bulls make money, Bears make money, but hogs get slaughtered"
Joined May 2014
|
Status: PVSRA with Traderathome
|491 Posts
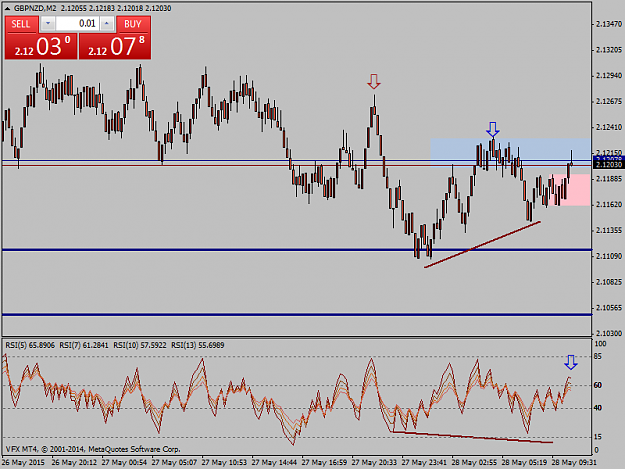
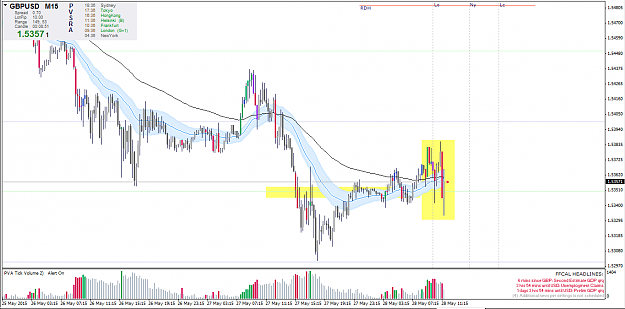
GBPUSD Comment:
Wow, MMs deceive the retailer traders whi this whip n whacks pullback the price below half level to creat more liquidities and add their longs then run the bull while the momentum comes on this LS.
Attached Image (click to enlarge)
"Bulls make money, Bears make money, but hogs get slaughtered"
GBPUSD Comment: Wow, MMs deceive the retailer traders whi this whip n whacks pullback the price below half level to creat more liquidities and add their longs then run the bull while the momentum comes on this LS. {image}
Ignored
Mauro, Yes I see this now thanks What would be your clue to enter long here?
Edit: I have a pending buy at 1.5385