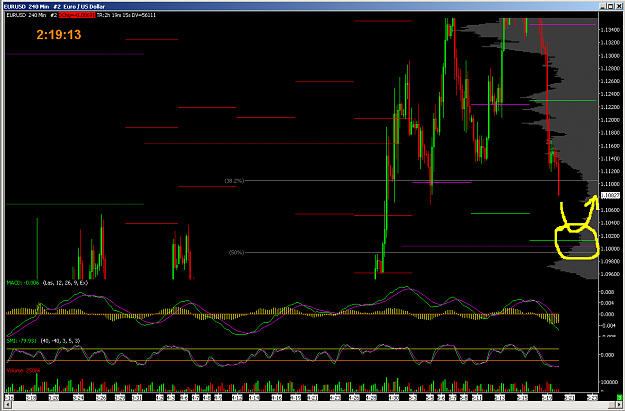
Disliked{quote} For the second option, we would come back to the channel, and to 1.14 levels, isn'it? About murray , 1,1120-00 is not an overextension? Bearing in mind the way that has been done.Ignored
When Oil and EU swing further in tight correlation, that may work out
Regarding Murrey Math
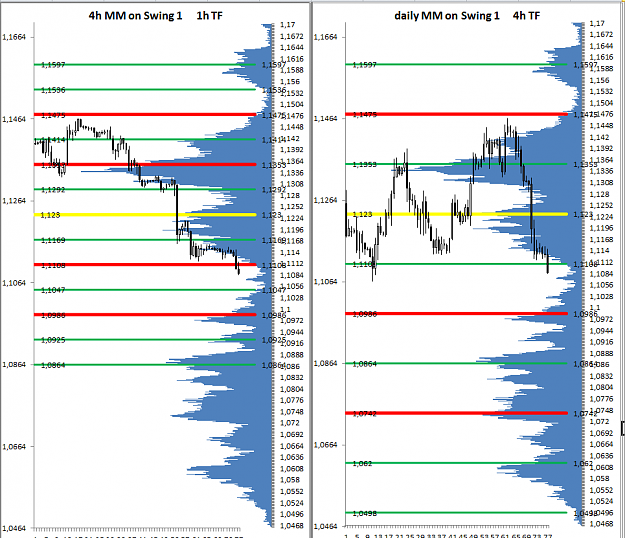
When you see such strong Momentum moves,either switch to higher TF's (look at the right chart, the daily Murrey), or stay away from Murrey. Keep in mind:
it works best in sideways movements
also read here:
http://www.forexfactory.com/showthre...76#post4500676
And here:
starting page from my old Shangri-La thread
http://www.forexfactory.com/showthread.php?t=329948
excerpt:
Murrey Math:
my Murrey Math indicator for MT4 http://www.forexfactory.com/attachme...202012%2016:13
http://tradinglib.com/indicators/murrey-math
http://howitworks.mymurreymath.com/
http://www.forexfactory.com/attachme...202012%2015:33
http://www.foretrade.com/MM_description.htm
http://www.bonniehill.net/pages/murrey.html
http://www.forexfactory.com/showthre...76#post4500676
http://meta4valas.blogspot.de/2010/0...rrey-math.html
http://www.forexfactory.com/showthre...52#post4201852
http://www.forexfactory.com/showthread.php?t=159471
http://www.forexfactory.com/showthread.php?t=202379
Maybe read this article first:
http://www.foretrade.com/MM_description.htm
http://www.forexfactory.com/showthre...76#post4500676
The math behind that all is a bit hard to understand. Especially when you read the links directly from Murrey himself. You will see.......
To simplify the method:
price tries to find its equilibrium. So when price travels in one direction or the other, it will come back to the equilibrium or build a new one. The longer price travels in one direction, the higher the probability for a reversal. And that is the point of Murrey Math - to define areas of probability for reversal.
The Murrey Math indicator looks back a certain period of time (for Forex this look-back period (p-value) is best set to 32) to find the high and low in this period. Then it calculates with regard to Murrey's rules the equilibrium and the octave lines/Murrey Math trading lines. Basically, there is no need to understand the detailed math behind that.
Keep in mind: the original Murrey Math method is very complex. It comes with "circles of conflicts", "speed angles" and a few more. I do only use the horizontal lines of his Method, called the "octave lines" or "Murey Math Trading Lines" (MMTL).
This lines define the playing field for the next moves. The 4/8 line is the center, where price has its equilibrium.
Now when price travels in one direction, 3 factors judge the probability for reversal:
a) price relative to the MMTL
b) number of MMTL price took out on its journey since its last change in direction
c) time
The octave lines are influenced by two factors:
a) price
b) time
When forces push price in one direction and it runs out of the octave, the octave has to be calculated anew. That will cause the "octave jump".
But price influences the octave too. Because, like I mentioned above, the Indicator looks back a certain period of time and calculates the lines. One can see the influence of time very well, when price made a big move in short time. The octave lines are now fairly wide spaced. Now when price goes in a sideways range with little amplitude you can see, that the octave lines will come narrower and narrower. You see: time can cause octave jumps too.
Best is to use the Murrey Math MT4 indicator I did provide at the starting page of Shangri-La, because this Indicator calculates the lines in the right way. There are some indicators out, which calculate wrong.