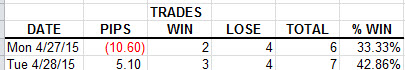
Week ending 24 April 2015
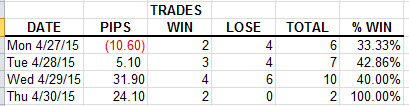
I had two days where I had gains less than my daily minimum goal of 20 PIPs, but I had enough to have a total of 100 PIPs for the week which is my minimum goal for a week. Today I had some decisions such as entering too soon after the U.S. reports. The EUR/USD had not settled down enough so I had a total loss of 25.7 PIPs, but my last trade had a gain of 32.6 PIPs leaving me with a gain of 7.5 PIPs for the day. I did not trade as well as I should, but I know I will have days like today or yesterday. My method is sound, but I will have to stick with my rules.
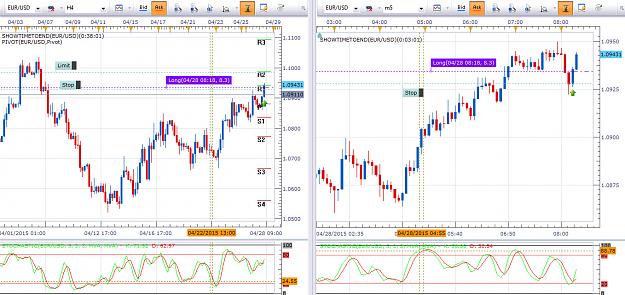
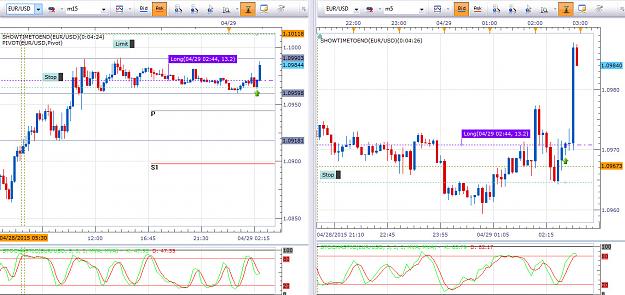
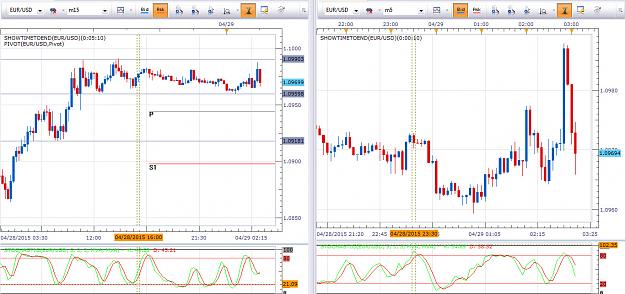
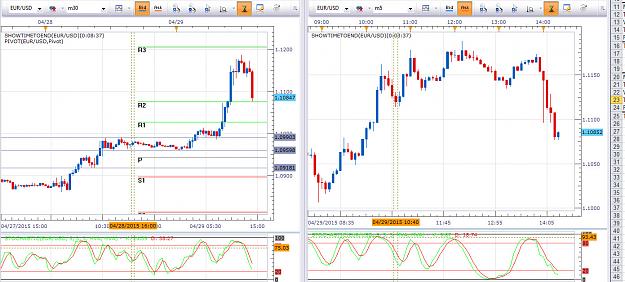
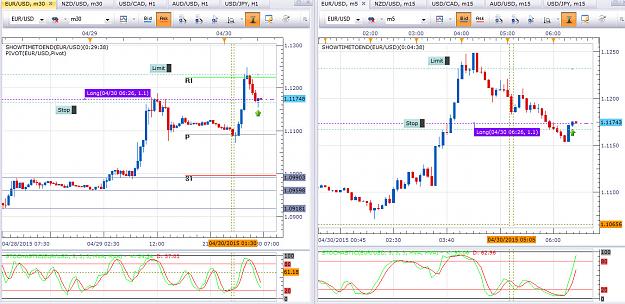
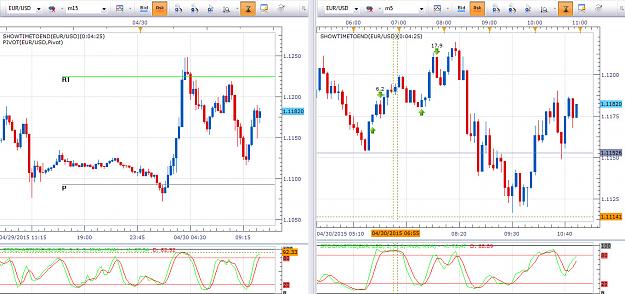
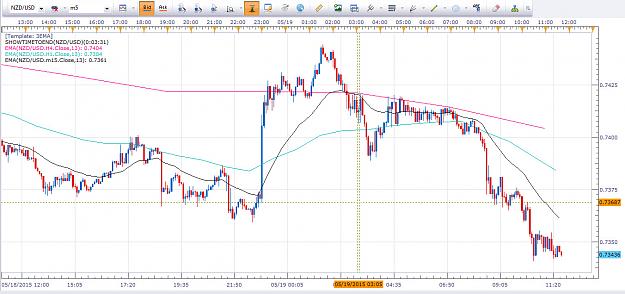
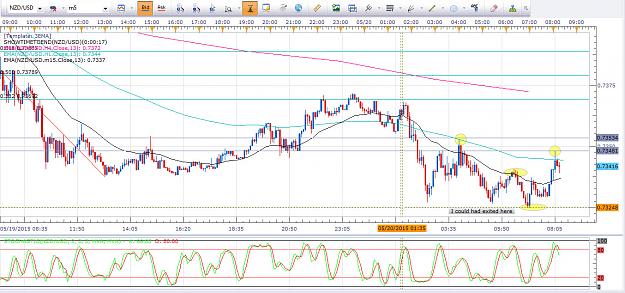
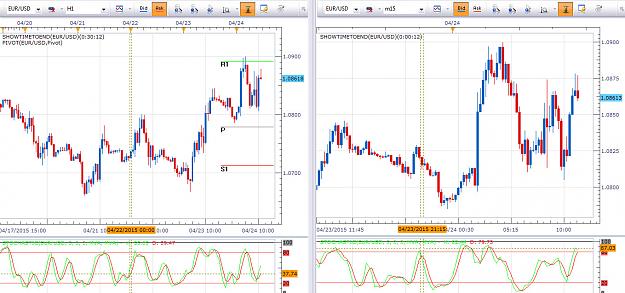
I use a split screen with the longer time frame on the left and the shorter time frame on the right. I use the one hour bar chart for five days for my longer time frame and the fifteen bar chart for one day for my shorter time frame. I primarily base my decision by the price action I see from the price bars, but I do use the stochastic indicator using the default setting of 5,3,3,MVA as confirmation of my trade decision. The longer time frame chart on the left helps me see the direction and support and resistance levels. Once the price gets close to the support or resistance area the stochastic indicator is going to show close to over bought or over sold. At that time I switch to five minute bars and move my stop loss.
I had two days where I had gains less than my daily minimum goal of 20 PIPs, but I had enough to have a total of 100 PIPs for the week which is my minimum goal for a week. Today I had some decisions such as entering too soon after the U.S. reports. The EUR/USD had not settled down enough so I had a total loss of 25.7 PIPs, but my last trade had a gain of 32.6 PIPs leaving me with a gain of 7.5 PIPs for the day. I did not trade as well as I should, but I know I will have days like today or yesterday. My method is sound, but I will have to stick with my rules.
I use a split screen with the longer time frame on the left and the shorter time frame on the right. I use the one hour bar chart for five days for my longer time frame and the fifteen bar chart for one day for my shorter time frame. I primarily base my decision by the price action I see from the price bars, but I do use the stochastic indicator using the default setting of 5,3,3,MVA as confirmation of my trade decision. The longer time frame chart on the left helps me see the direction and support and resistance levels. Once the price gets close to the support or resistance area the stochastic indicator is going to show close to over bought or over sold. At that time I switch to five minute bars and move my stop loss.
Attached Image (click to enlarge)
Attached Image