Improved Bollinger Bands indicator. In this comment PipMeUp discusses problems with the standard implementation of the Bands indicator. His objections are: 1) The number of samples for the deviation should be typically much bigger than the one for the MA. This implementation allows this, as you can specify the numbers separately. 2) The lag of the simple moving average is half of its period. If we subtract the moving average at position from the price at candle ...
Ignored
Hi Kprsa!
I've two questions for you
1) Bollinger Bands: Since the samples for the deviation should be greater than the one for the MA, i would like to know if there is a "optimal" relation between the two samples... how much bigger the deviation samples should be???
2) Recurrence Indicator: In your wonderfull indicator you give us the "Max width of the problem zone <k>" for the different kind of bars.... if possibile it would be usefull if the indicator state the date and time where the max problem has been measured. Just to give a complete information, where i can check with my eyes and see what happened there
{quote} After a second look, I am wrong in saying this, this would actually be a correct procedure in its world. The current SMA is of course the mean value over the past period so it does make sense, even though not taking trends into account is painfully imprecise. Sorry, k
Ignored
I'm late to the debate but just wanted to add that if you perform time series analysis using the mean and standard deviation, you are implicitly assuming that the distribution is normal. This is the case with parametric statistical measures. The implication is that if the distribution is not normal, then you will draw false conclusions about the true nature of the distribution. This is my view of indicators like standard deviation bands (BB) because you can't properly estimate the % of the data outside the bands based on the normal distribution.
Therefore there are three very important assumptions that are made when using parametric statistical techniques:
All the treatment populations are normally distributed (the normality assumption).
The normal distributions have the same standard deviation (or variance; the assumption of homogeneity of variance assumption)
The data is taken from an interval or ratio scale (Since it is impossible to have normal distributions on any other kind of
...
It is also worth noting that the mean is referred to as the expected value. IMO the mean doesn't very well represent the expected value. That said, a shifted mean does a much better job, however you are late half the period, and so for applicability to real-time trading you must predict the adjusted mean several periods into the future, which is essentially just a variation of predicting where price will be in 1/2 length in the future (a really hard problem).
Also worth noting is that implicit in the standard deviation calculation is the assumption that the mean is stationary. This is also not true for market data. Also in the quote above, it assumes market data has a constant variance. Market data is heteroskedactic, or in other words has time varying variance.
IMO one of the most important features of "indicators" is timeliness. This is why in practical terms I've found more application of real-time indicators such as standard deviation bands (with the above defects) than of mean-shifted measures, due to the hard right edge of the market, which IMO seems to be the most important factor (timeliness).
{quote} I'm late to the debate but just wanted to add that if you perform time series analysis using the mean and standard deviation, you are implicitly assuming that the distribution is normal.
{quote} Hi Kprsa! I've two questions for you 1) Bollinger Bands: Since the samples for the deviation should be greater than the one for the MA, i would like to know if there is a "optimal" relation between the two samples... how much bigger the deviation samples should be??? 2) Recurrence Indicator: In your wonderfull indicator you give us the "Max width of the problem zone <k>" for the different kind of bars.... if possibile it would be usefull if the indicator state the date and time where the max problem has been measured. Just to give a complete...
Ignored
Hi Ghizzo,
1) No optimal value, but you need approximately 200 samples to have reasonable values for the standard deviation. For MA according to your preferences.
2) Sorry, no time.
{quote} There was no debate. {quote} No. Please go away. k
Ignored
I admit, I am puzzled by this response. I had hopes that we could have an intelligent exchange of ideas in this thread. I was mistaken. I won't make that mistake again.
Improved Bollinger Bands indicator. In this comment PipMeUp discusses problems with the standard implementation of the Bands indicator. His objections are: 1) The number of samples for the deviation should be typically much bigger than the one for the MA. This implementation allows this, as you can specify the numbers separately. 2) The lag of the simple moving average is half of its period. If we subtract the moving average at position from the price at candle ...
{quote} I admit, I am puzzled by this response. I had hopes that we could have an intelligent exchange of ideas in this thread. I was mistaken. I won't make that mistake again. Best regards, FXEZ
Ignored
OK. Ralome has through his previous actions greatly positively influenced my trading. In order to return this massive favor to him, I have gone through significant expense of time and effort to explain what the indicator was supposed to do, and why one should not do it the other way around. There was no debate. Now, to you I am not indebted in this way. However this passive-aggressive comment is so annoying (good job!) so I will go through all the conversational/logical errors in your first comment.
{quote} if you perform time series analysis using the mean and standard deviation, you are implicitly assuming that the distribution is normal.
Ignored
No, this is not true (and is the basis of the strawman argument that is the entire first paragraph). There are dozens of possible distributions where this approach would hold. Also, I was clear in the previous posts that the distribution is not Gaussian for the time based chart, and have linked the PipMeUp's result that the distribution is normal when one has range bars (where it would hold, but also the supposed "implicit assumption" would hold true).
{quote} This is my view of indicators like standard deviation bands (BB) because you can't properly estimate the % of the data outside the bands based on the normal distribution.
Ignored
I agree with this, but I have never claimed that I could. If you are trying to say that "one can't properly ...", I would have no problem with this sentence. The problem with your argumentation is that you are inputting me all the elementary statistics errors you can think of, and it is quite an annoying conversation style.
{quote} It is also worth noting that the mean is referred to as the expected value. IMO the mean doesn't very well represent the expected value. That said, a shifted mean does a much better job, however you are late half the period
Ignored
Which is why this indicator is doing (and was explained multiple times), so I do not really have to note anything.
{quote}and so for applicability to real-time trading youmust predict the adjusted mean several periods into the future, which is essentially just a variation of predicting where price will be in 1/2 length in the future (a really hard problem).
{quote}Also worth noting is that implicit in the standard deviation calculation is the assumption that the mean is stationary. This is also not true for market data.
Ignored
This is equally worth noting as the other piece of information that was worth noting before. I have gone through great efforts over the last 10 comments showing that one ends up with the wrong values if one assumes that the mean is stationary.
{quote}Also in the quote above, it assumes market data has a constant variance. Market data is heteroskedactic, or in other words has time varying variance.
Ignored
I am aware of it, which is why one takes population samples (by default N=200) to estimate the stdev and doesn't take all the available data to estimate it. There is even a version of the indicator, that finds the minimum, maximum and the average of stdev and prints it as a Comment.
{quote}IMO one of the most important features of "indicators" is timeliness. This is why in practical terms I've found more application of real-time indicators such as standard deviation bands (with the above defects) than of mean-shifted measures, due to the hard right edge of the market, which IMO seems to be the most important factor (timeliness).
Ignored
Thank you. Now this is the conversation style that I would encourage in this thread. But why do I have to go through all that garbage inside your post to reach one thing that is potentially useful?
{quote} I agree that it should be no difference when the price mean is flat with respect to time. Then also the lag of the moving average will be equivalent to zero, so in this case the lag correction is unimportant. But things do change in a trend. The blue line in the plot below is the standard SMA, the red is shifted back by a half of its period. Would you calculate the standard deviation based on subtracting the data off the first or the second line? Do you think it is the same in this case? {image} {quote} In principle one part of the problem...
Ignored
Hi mate,
About the prob calc there ... using RS_V42 if i get the value like this below for h_left=30, h_right=30 & 20 :
Quote
Disliked
30/20 | 30/30 => h_left/h_right
----------------------------------------------------------
73,259 | 77,615 => Prob of Trans bar resolved
82,1688 | 85,376 => Prob of Frac bar resolved
At current situation, we have a blue fractal arrow, and we are on the 3rd bars to the right of that blue arrow.
a) If i want to know the probability of that arrow will be totally resolved in 20 bars after its position, must i calculate it like this ?
(85,376 - 82,1688) / (100 - 82,1688)
b) Does it mean that we don't care at which position we are now (after that blue arrow), we just need to know that h_right > current bar position after blue arrow to do the calculation (in this example 20 > 3).
{quote} Hi mate, About the prob calc there ... using RS_V42 if i get the value like this below for h_left=30, h_right=30 & 20 : {quote} At current situation, we have a blue fractal arrow, and we are on the 3rd bars to the right of that blue arrow. a) If i want to know the probability of that arrow will be totally resolved in 20 bars after its position, must i calculate it like this ? (85,376 - 82,1688) / (100 - 82,1688) b) Does it mean that we don't care at which position we are now (after that blue arrow), we just need to know that h_right > current...
Ignored
Hi, please post questions about the RS indicator in the thread where the indicator was posted.
k
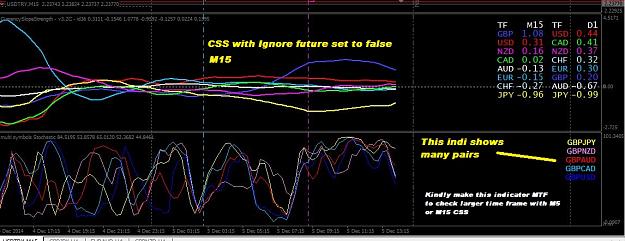
I am sorry to request something on this forum but having read your statement on the shouts, I had to post it here. I have found something interesting. And I think you are the one who can do it easily. I also sent you a request on Stevehopewood's website.
Kindly have a look at the attached pic. Look at GBP crossing the zero level, and look at the GBP pairs. Can we please make the attached indicator a multi symbol indicator as shown in the picture? The attached indi is a MTF and I wish you could add multi pairs option to the attached indicator.
K I am sorry to request something on this forum but having read your statement on the shouts, I had to post it here. I have found something interesting. And I think you are the one who can do it easily. I also sent you a request on Stevehopewood's website. Kindly have a look at the attached pic. Look at GBP crossing the zero level, and look at the GBP pairs. Can we please make the attached indicator a multi symbol indicator as shown in the picture? The attached indi is a MTF and I wish you could add multi pairs option to the attached indicator....
Ignored
Hi,
A Google search "multipair mtf stochastic" tells me that there exists already a multipair mtf stochastic done by mladen from forex-tsd forum. This is certainly a better option than anything I can do. mladen is a much better programmer than me.
k
Dear K The one shown in the pic is the one created by Mladen, but it is not MTF.
Ignored
As I said and have checked now, the first result of the Google search gives a link to the working multipair mtf stochastic indicator.
That problem is solved then, even though the indicator does not look exactly like the one you want.
Just to be clear, I make custom indicators based on my (or other people's ideas) ideas and sometimes share some of them, particularly so if they are based on other people's ideas. I even occasionally go out of my way to do minor changes to those indicators as per requests. I don't have the time to do much more than this.
I think there are good programmers at FF, who would probably be happy to program your indicator for a reasonable fee - I am just not in this line of business.
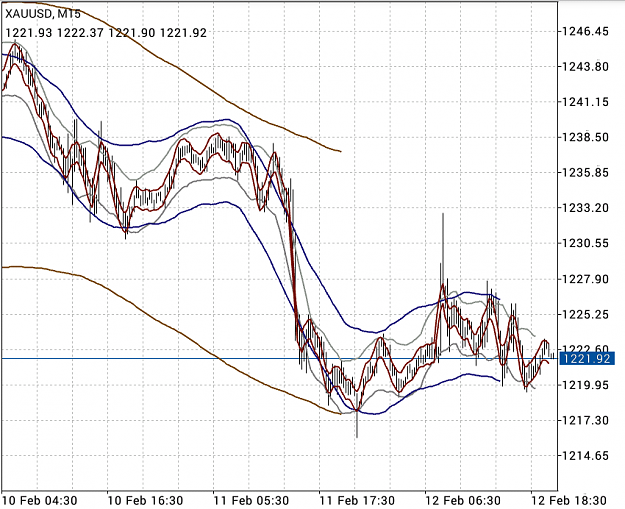
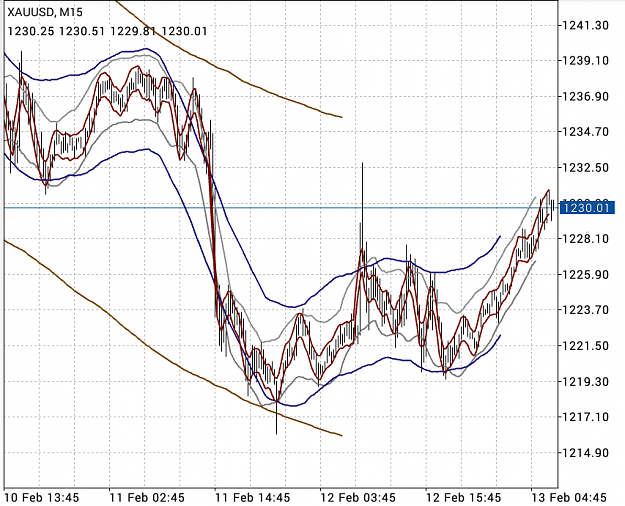
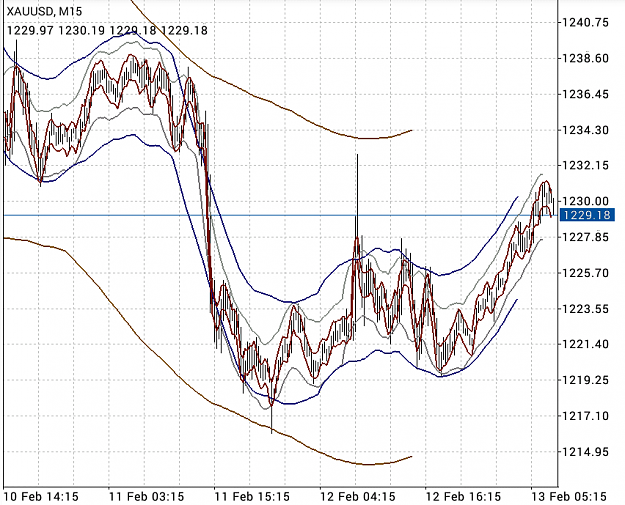
Not working as expected, price went up almost 100 pips. Even though one could argue that a bounce from the brown envolepe could be expected in the picture above, the agreement in direction of the four envelopes/MAs was suggesting a more likely move down.
{quote} I'm late to the debate but just wanted to add that if you perform time series analysis using the mean and standard deviation, you are implicitly assuming that the distribution is normal. This is the case with parametric statistical measures. The implication is that if the distribution is not normal, then you will draw false conclusions about the true nature of the distribution. This is my view of indicators like standard deviation bands (BB) because you can't properly estimate the % of the data outside the bands based on the normal distribution....
Ignored
I am even later to this thread LOL. Your comments about normality are both right and wrong. Depends on the context. Totally correct if applied to a fixed sample set. This is why statistical analysis of price data of financial instruments including forex pairs display non-normal distributions and fat tails. These findings are always based on a fixed data set.
Based on the above findings most people dismiss Bollinger Bands as an invalid trading tool. Don't be so fast. Fact is a moving average is different to an average of a fixed data set. A moving average uses a travelling data set. As price action develops the data set travels to the right to incorporate the newest data point and drop the oldest data point. The result, forced or fabricated normality. Suggest people read Bollinger on Bollinger Bands as he was acutely aware of the above issues when he developed them. But alas people take stuff written here at face value and don't ever check the original sources.