Great system you guys have here! I am impressed with how much work you guys have put in here. I have always been a fan of trading HA candles because of how simple the make the price action. Like Emmanuel7788 said price action is the one thing that will stand the test of time. I'm already trading using mainly HA candles but I am curious to see how implementing the ideas in this thread could help me. sis.
Ignored
Sis.yphus,
Welcome to Tms.
A lot of people have worked on this system for years.
I guess the reason is (1) it works & (2) it's fun.
Hello All, New here and am trying to learn method , could anyone plssssss help with correct TDI to use the heiken or synergy not sure what this difference is and LASTLY, most importantly post or PDF detailing to read, understand and implement this method.(Not being lazy, 2584 pages you will agree is much} thanks one , thanks all Emmanuel7788 , I SALUTE YOUR PERSON RESPECT to the original owner of this thread
Ignored
UkTrade,
Welcome to Tms...
Their are a few different Tdi indicators.
Some have a rsi value of 13, some with a rsi value of 10.
The Tdi I use is (Synergy Tdi Pro, rsi value 10), in paper clip on top of the page.
I think if you read all the posts since October 2014, this will really
help you. These posts have the indicators & template in them and will
explain exactly what we are doing.
{quote} After loosing around usd 3k in last 2 days, finally my all 3 positions are green now!! Thanks Emmanuel for you help!! I use my iPhone for trading and I think TDI is not available for iPhone metatrader app.. Please help me if you know any other option. I have day job so I can use my desktop in night only, I would appreciate if you can share latest template. Thanks BK BK
Ignored
Bk8,
Would you post a couple of charts so I can see
what your using & doing!
I think you should stop trading until we can figure
out what your doing! Your doing something drastically
wrong...give us the time & info to help you figure it out.
Thank you very much for even responding to me, most appreciated , I will definitely go straight to October 2014 to begin my journey. Can you pls help me with the average price bar you use and also just to confirm the PAC is 5 smooth high and 5 smooth low moving average?
sorry for the troubles.
thanks
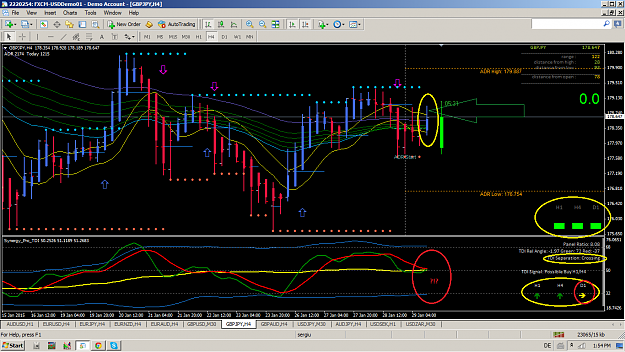
Took a buy on London Open this morning on the M30 Chart. Entered on Candle 1 away from PAC Guppy and Daily Open. Good TDI angle, Angleator 3xgreen up, H1 H4 D1 green. Only worry was going into the 200 EMA. Took TP just under resistance and previous day's high. Q for our seniors : How strong is this 200 EMA in your decision process ? {image}
Ignored
Zef,
I definitely know where the 200 ema is!
The institutions know where the 200 ema is.
Lot's of traders use the 200 ema & know where it is.
Follow what the institutions are using & doing...
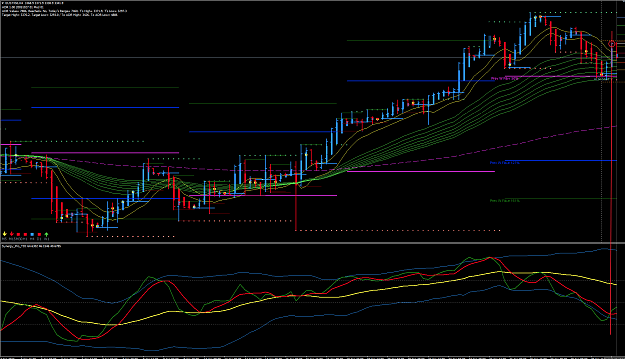
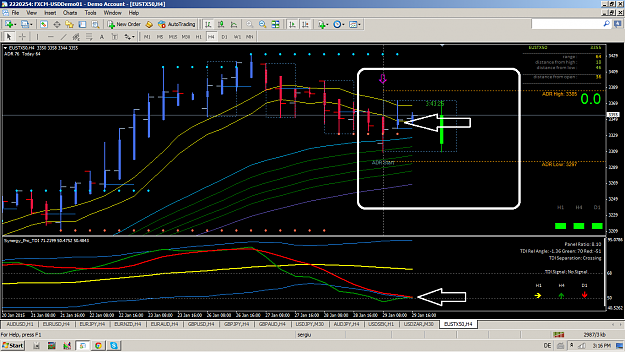
I made this trade, and it turned to a loser... again, can any body explain what I did wrong? Lastly I don't get a single green trade.
This is EUSTX50, 4H. I entered on long on the close of the candle which closed above PAC, and TDI was crossing. The candle itself was strong and came after a hammer.
Attached Image (click to enlarge)
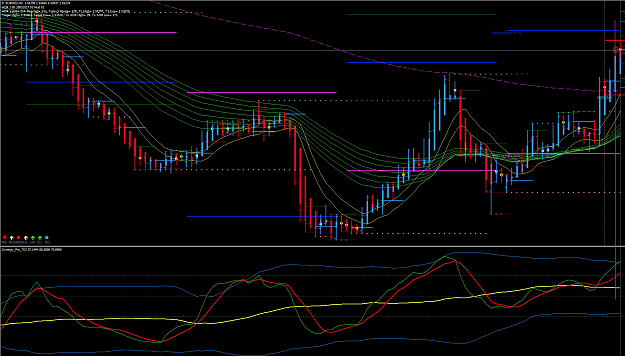
EUR/NZD 4H.
Attached Image (click to enlarge)
This last one is on red, still not closed. I thought that it could go up, H4 and D1 are trending up strong, but again, turned down. Did I enter too late on this one? PA was doing fine.
Thanks again.
Had to be me. Someone else might have gotten it wrong.
{quote} Do you mean that we should check the daily chart for direction before going down to the H4 or H1?
Ignored
Cosmo,
When your trading the lower time frames (1 hour tf)
You always want to know what the 4 hour & daily
charts are telling you.
Most people will check the next higher time frame they
are trading. For example your trading the 1 hour chart,
look at the 4 hour chart for trend. It's safer trading
this way...
{quote} Perfect, thanks a lot!! Sorry to bother you again but you will save my time if you let me know post# for the latest Template for the desktop.. please ignore if you have to search as well. Thanks Again BK
Ignored
Bk8,
Read every post since October 2014, This will help you!
The indicators & template are in these posts
sj
I made this trade, and it turned to a loser... again, can any body explain what I did wrong? Lastly I don't get a single green trade. This is EUSTX50, 4H. I entered on long on the close of the candle which closed above PAC, and TDI was crossing. The candle itself was strong and came after a hammer. {image} EUR/NZD 4H. {image} This last one is on red, still not closed. I thought that it could go up, H4 and D1 are trending up strong, but again, turned down. Did I enter too late on this one? PA was doing fine. Thanks again.
Ignored
Mordin,
Just glancing at your trade, I would say your Tdi
is in the wrong place. I would look at the 200 ema
for my long term trend.
{quote} Brekz1, The pac is a smoothed 5 high & a smoothed 5 low. Some people put in a shift +1, some people don't use the shift. The pac & tdi that I use is in the Synergy Pro template. sj
{quote} Mordin, Just glancing at your trade, I would say your Tdi is in the wrong place. I would look at the 200 ema for my long term trend. sj
Ignored
Thank you very much, you always help me a lot. I don't quite understand what are you referring, on both charts 200 ema is pointing up, which is the direction I was trading, besides that, I don't look for long term positions, looking at old charts, I could have a trade open for until a week or so.
Thanks again sj!
Had to be me. Someone else might have gotten it wrong.
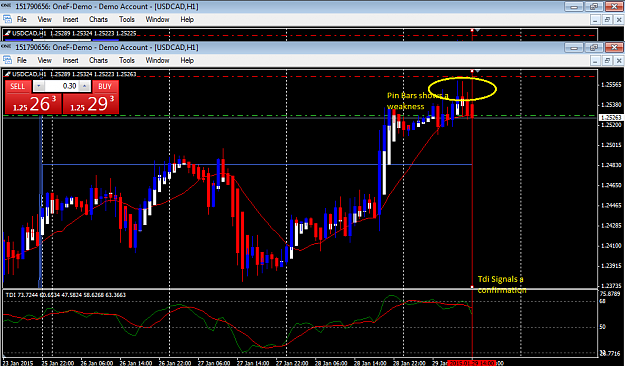
i took this short trade on e/u last night, and made 80 pip from it including the spread. my entry: good size synergy body, and angle of tdi. exit: small size synergy body, and tdi 'so-so' flat. let me hear what you guys think of it? was it pure luck, or do you agree with my entry & exit. Thanks! {image}
Ignored
Merrygold,
I think using the pac would help you!
Good trade 80 pips is 80 pips
Congrat's.
sj
I made this trade, and it turned to a loser... again, can any body explain what I did wrong? Lastly I don't get a single green trade. This is EUSTX50, 4H. I entered on long on the close of the candle which closed above PAC, and TDI was crossing. The candle itself was strong and came after a hammer. {image} EUR/NZD 4H. {image} This last one is on red, still not closed. I thought that it could go up, H4 and D1 are trending up strong, but again, turned down. Did I enter too late on this one? PA was doing fine. Thanks again.
Ignored
Mordin,
The same timeframe looks completely different on my chart ? . Candle closes inside PAC and there's no signal.
{quote} Thank you very much, you always help me a lot. I don't quite understand what are you referring, on both charts 200 ema is pointing up, which is the direction I was trading, besides that, I don't look for long term positions, looking at old charts, I could have a trade open for until a week or so. Thanks again sj!
Ignored
Mordin,
If you check out some of MrAussiefx training charts with
explanations he explains how the tdi should look. I think
he gave some excellent examples...
sj
[Quote = redcloudxlll; 8032081] {quote} Eu tive a mesma pergunta um pouco para trás e alguém me ajudou a sair aqui está. Você pode replicar o TDI usando qualquer plataforma fornecida indicador RSI. Aqui está como fazê-lo. Como replicar o TDI usando o indicador padrão RSI. O Traders Index dinâmico aka TDI é, na verdade, três médias móveis dos dados RSI. Os parâmetros predefinidos são: o TDI Preço linha verde Linha PL é um SMA (2) do RSI (período de 13, Primeiro Price). Em seguida, a linha vermelha TDI Trade linha de sinal é um SMA (7) da linha verde...
Ignored
Macd,
You need to communicate with us in "english"!
Their are about 4-5 different tdi floating around this thread?
The original tdi used a rsi value of 13. Since then, Dean Malone
the creator of the tdi has reworked the formula & changed the rsi
value to 10. The new tdi (synergy pro tdi) is a real time (changes tick
by tick). The old tdi was fixed on the bar close.